Technical Analysis of MEGL 2024-05-10
Overview:
In analyzing the technical indicators for MEGL over the last 5 days, we will delve into the trend, momentum, volatility, and volume indicators to provide a comprehensive outlook on the possible stock price movement in the coming days.
Trend Analysis:
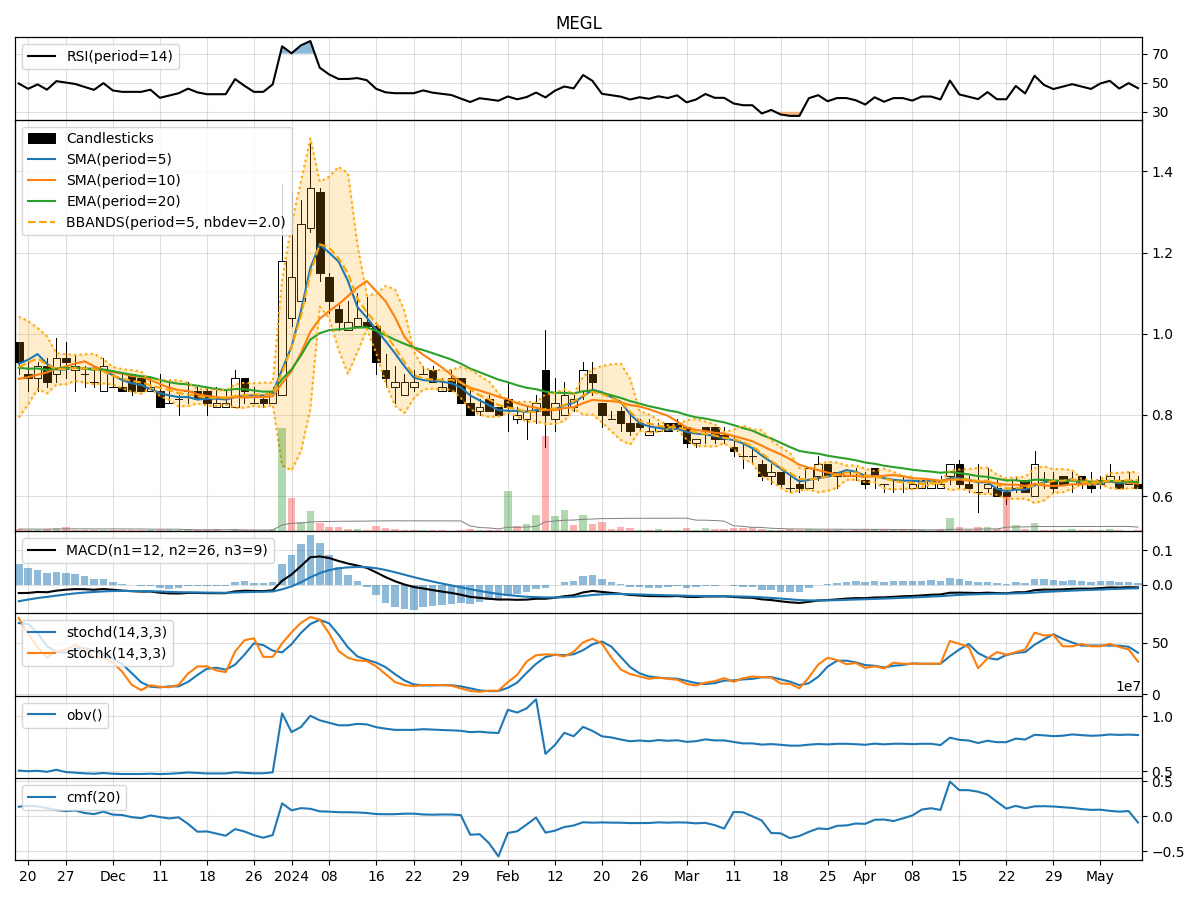
- Moving Averages (MA): The 5-day Moving Average (MA) has been fluctuating around the 0.632-0.634 range, indicating a lack of clear trend direction.
- MACD: The Moving Average Convergence Divergence (MACD) has been consistently negative, suggesting a bearish momentum in the short term.
- EMA: The Exponential Moving Average (EMA) has been relatively stable around 0.635-0.637, showing a neutral trend.
Momentum Analysis:
- RSI: The Relative Strength Index (RSI) has been hovering around 45-51, indicating a neutral momentum with no extreme overbought or oversold conditions.
- Stochastic Oscillator: Both %K and %D of the Stochastic Oscillator have been declining, signaling a weakening momentum.
- Williams %R: The Williams %R has been in the oversold territory, suggesting a bearish sentiment.
Volatility Analysis:
- Bollinger Bands (BB): The Bollinger Bands have shown narrowing bands, indicating decreasing volatility and a potential period of consolidation.
- BB%: The %B indicator has been fluctuating around 0.2-0.8, reflecting mixed volatility levels.
Volume Analysis:
- On-Balance Volume (OBV): The OBV has been on a downtrend, suggesting selling pressure and a bearish sentiment.
- Chaikin Money Flow (CMF): The CMF has been fluctuating around 0.06-0.09, indicating a neutral money flow.
Conclusion:
Based on the analysis of the technical indicators, the stock of MEGL is likely to experience further downward movement in the coming days. The bearish trend indicated by the negative MACD, declining Stochastic Oscillator, and oversold Williams %R, coupled with decreasing OBV and lack of clear trend direction in moving averages, point towards a bearish sentiment in the short term. The narrowing Bollinger Bands and mixed volatility levels suggest a potential period of consolidation before any significant price movement.
Recommendation:
Investors should exercise caution and consider waiting for more clarity in the trend direction before making any trading decisions. Monitoring key support levels and waiting for a reversal in momentum indicators could provide better entry points for long positions. It is advisable to set stop-loss orders to manage risk effectively in case of further downside movement.
Disclaimer:
Remember that technical analysis is not a guaranteed predictor of future price movements, and other fundamental factors and market dynamics can influence stock prices. It is essential to conduct thorough research and consider multiple indicators before making any investment decisions. Consulting with a financial advisor can provide personalized insights tailored to your specific investment goals and risk tolerance level.