Technical Analysis of MDWD 2024-05-10
Overview:
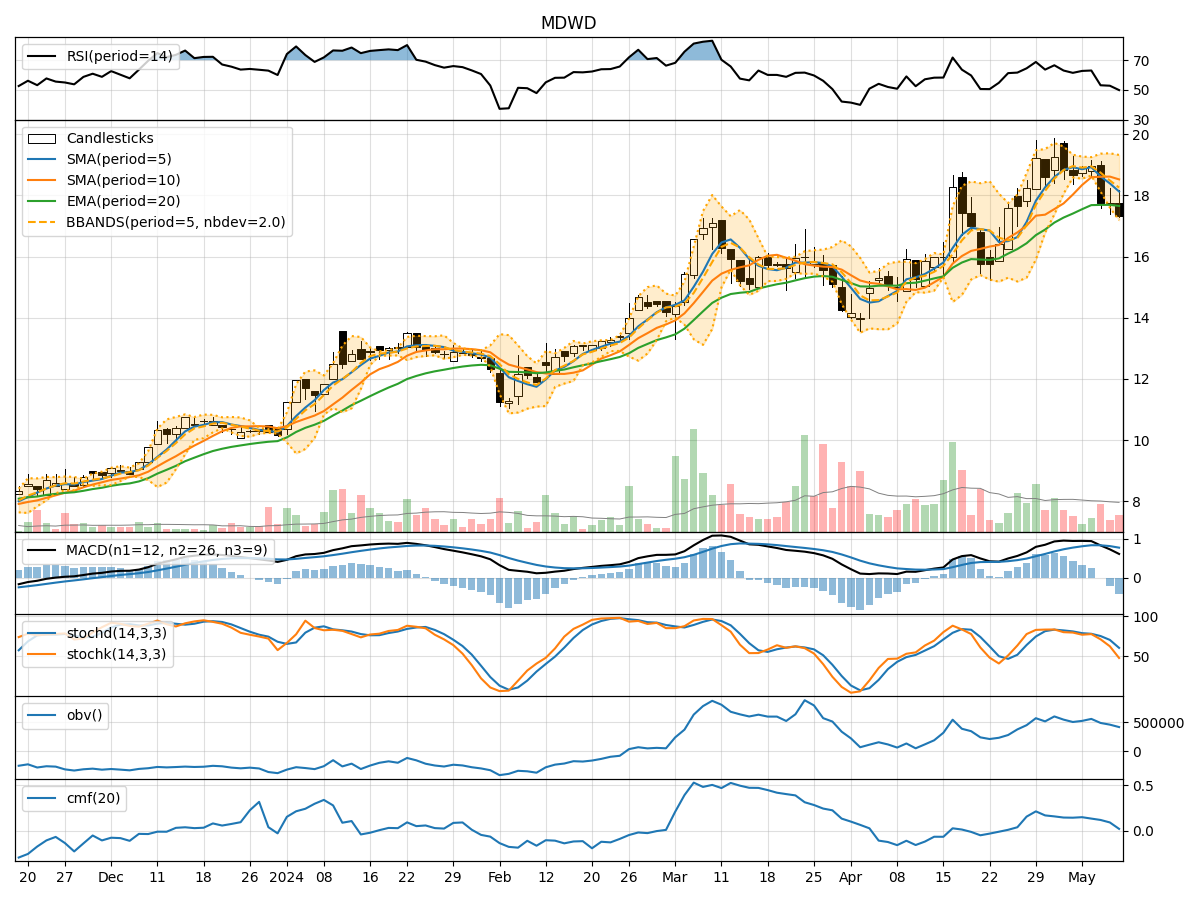
In analyzing the technical indicators for MDWD over the last 5 days, we will delve into the trend, momentum, volatility, and volume indicators to provide a comprehensive outlook on the possible stock price movement in the coming days.
Trend Analysis:
- Moving Averages (MA): The 5-day Moving Average (MA) has been fluctuating around the closing prices, indicating short-term price trends. The Simple Moving Average (SMA) and Exponential Moving Average (EMA) have been relatively close, suggesting stability in the trend.
- MACD: The Moving Average Convergence Divergence (MACD) has shown positive values, with the MACD line consistently above the signal line. This indicates a bullish trend in the stock price.
- Conclusion: The trend indicators suggest a bullish sentiment in the short term.
Momentum Analysis:
- RSI: The Relative Strength Index (RSI) has been hovering around 50, indicating a neutral momentum in the stock.
- Stochastic Oscillator: Both %K and %D of the Stochastic Oscillator have been declining, moving towards the oversold region.
- Williams %R: The Williams %R is in the oversold territory, suggesting a potential reversal in the stock price.
- Conclusion: The momentum indicators point towards a bearish momentum in the short term.
Volatility Analysis:
- Bollinger Bands: The Bollinger Bands have been narrowing, indicating decreasing volatility in the stock price.
- Conclusion: The volatility indicators suggest a consolidation phase in the stock price.
Volume Analysis:
- On-Balance Volume (OBV): The OBV has been showing a slight decrease, indicating selling pressure in the stock.
- Chaikin Money Flow (CMF): The CMF has been declining, suggesting a decrease in buying pressure.
- Conclusion: The volume indicators imply a bearish sentiment in the short term.
Overall Conclusion:
Based on the analysis of trend, momentum, volatility, and volume indicators, the next few days' possible stock price movement for MDWD is likely to be downward. The trend indicators signal a bullish sentiment, but the momentum and volume indicators point towards a bearish outlook. The decreasing volatility and selling pressure indicated by volume indicators further support the bearish view.
Recommendation:
Considering the overall analysis, it is advisable to exercise caution in trading MDWD in the coming days. Investors may consider waiting for more clarity in the price action or implementing risk management strategies to mitigate potential losses. It is essential to monitor the key technical levels and market developments closely to make informed trading decisions.