Technical Analysis of MDJH 2024-05-10
Overview:
In analyzing the technical indicators for MDJH over the last 5 days, we will delve into the trend, momentum, volatility, and volume indicators to provide a comprehensive outlook on the possible stock price movement in the coming days. By examining these key aspects, we aim to offer valuable insights and predictions to guide your investment decisions.
Trend Analysis:
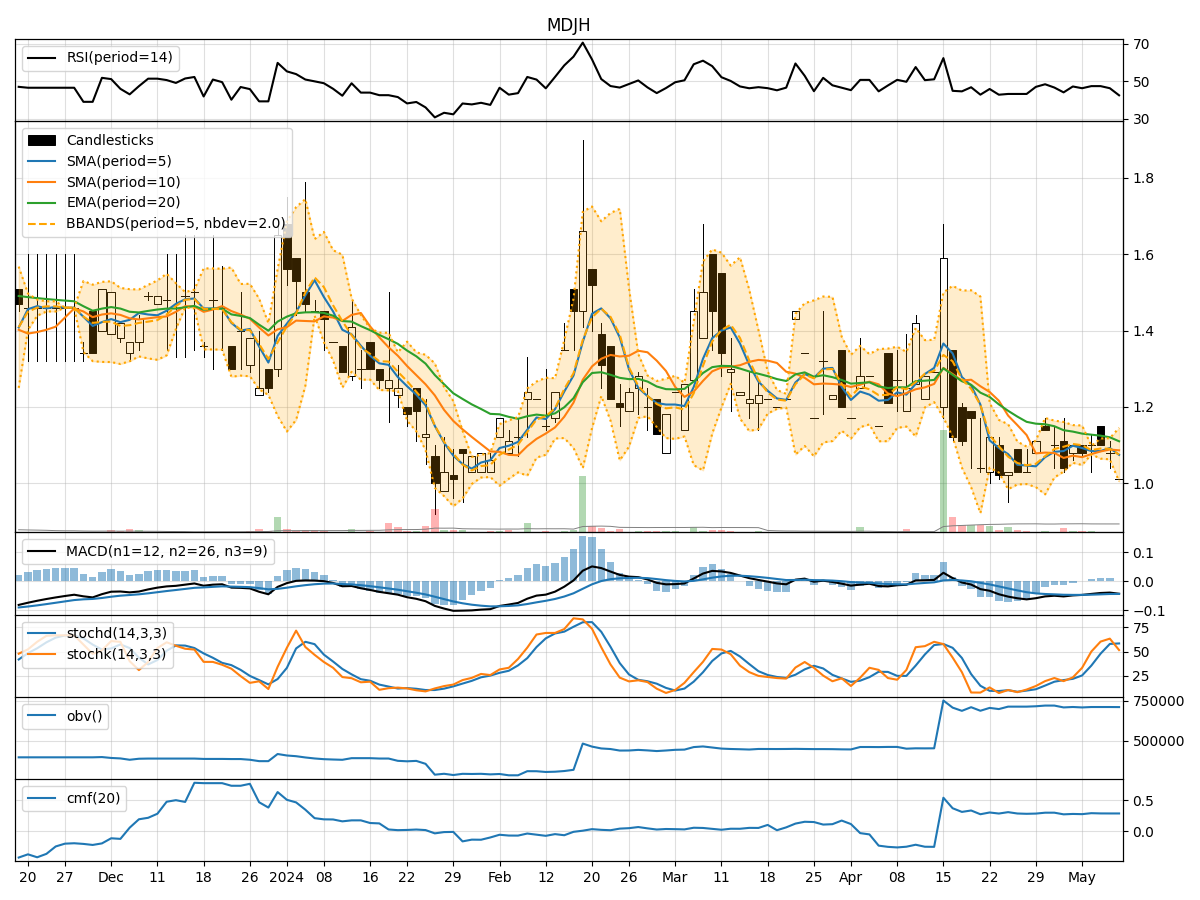
- Moving Averages (MA): The 5-day MA has been fluctuating around the current price, indicating a lack of clear trend direction.
- MACD: The MACD line has been consistently below the signal line, suggesting a bearish momentum in the short term.
- EMA: The EMA has been gradually declining, reflecting a weakening trend.
Key Observation: The trend indicators point towards a bearish sentiment in the short term.
Momentum Analysis:
- RSI: The RSI has been hovering around the neutral zone, indicating a lack of strong momentum.
- Stochastic Oscillator: Both %K and %D have shown mixed signals, with no clear indication of overbought or oversold conditions.
- Williams %R: The Williams %R is in the oversold territory, suggesting a potential reversal.
Key Observation: Momentum indicators suggest a neutral to slightly bearish outlook.
Volatility Analysis:
- Bollinger Bands: The price has been trading within the bands, indicating a period of consolidation.
- Bollinger %B: The %B is close to 0.5, signifying equilibrium between buying and selling pressure.
Key Observation: Volatility indicators signal a sideways movement in the stock price.
Volume Analysis:
- On-Balance Volume (OBV): The OBV has remained relatively flat, indicating a balance between buying and selling pressure.
- Chaikin Money Flow (CMF): The CMF has shown a slight increase, suggesting a potential inflow of money into the stock.
Key Observation: Volume indicators imply a neutral stance in terms of market participation.
Conclusion:
Based on the analysis of trend, momentum, volatility, and volume indicators, the overall outlook for MDJH in the next few days leans towards a sideways movement with a slightly bearish bias. The stock is likely to continue trading within a range, potentially experiencing minor fluctuations but lacking a clear trend direction. Investors should exercise caution and closely monitor key levels for potential entry or exit points.
Recommendation:
Considering the mixed signals from the technical indicators, it is advisable to adopt a wait-and-see approach before making any significant trading decisions. Traders may consider setting tight stop-loss orders to manage risk effectively in the current uncertain market environment. Additionally, staying informed about any upcoming company news or market developments could provide valuable insights into potential price movements.