Technical Analysis of MAXN 2024-05-10
Overview:
In analyzing the technical indicators for MAXN over the last 5 days, we will delve into the trend, momentum, volatility, and volume indicators to provide a comprehensive outlook on the possible stock price movement in the coming days. By examining these key indicators, we aim to offer valuable insights and recommendations for potential investors.
Trend Analysis:
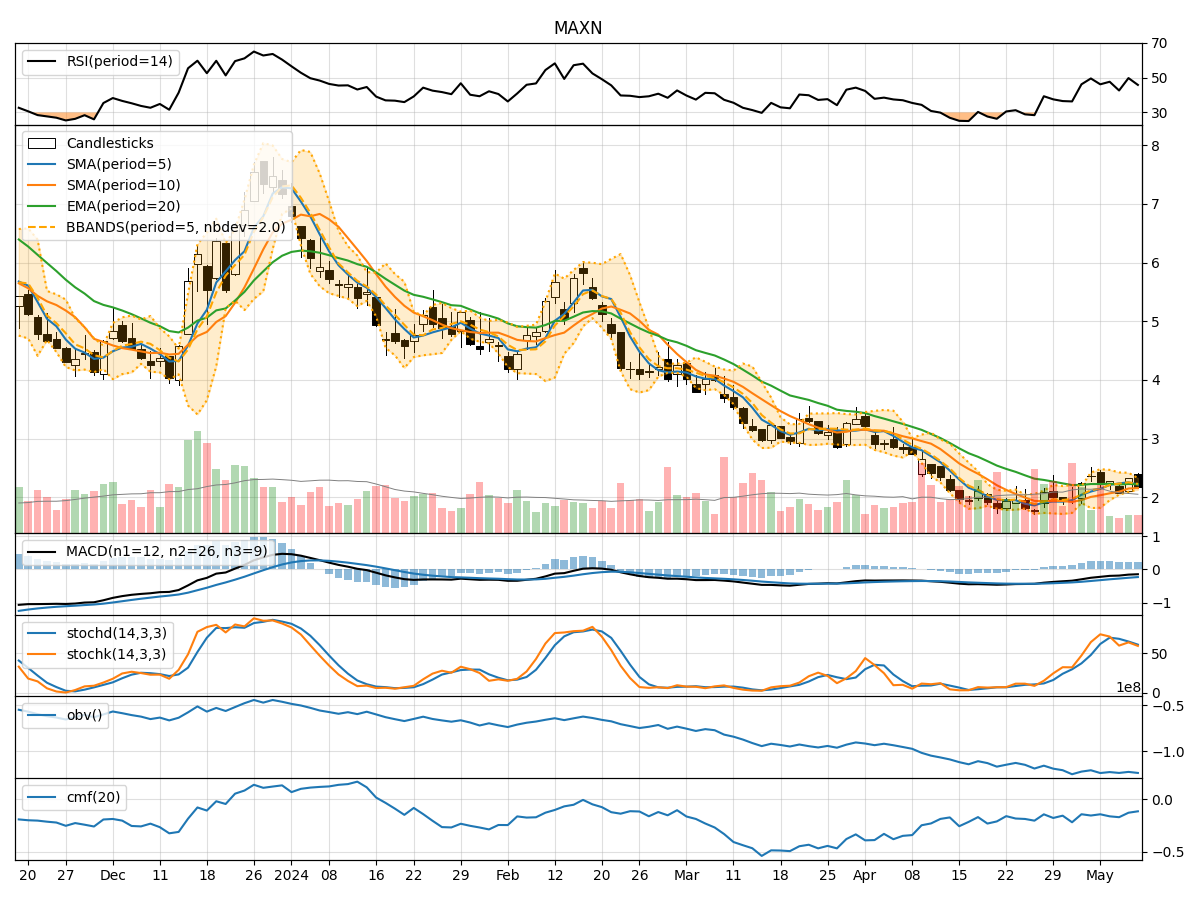
- Moving Averages (MA): The 5-day Moving Average (MA) has been fluctuating around the closing prices, indicating short-term price trends.
- MACD: The Moving Average Convergence Divergence (MACD) has been negative but showing signs of convergence, suggesting a potential shift in momentum.
- EMA: The Exponential Moving Average (EMA) has been relatively stable, reflecting a smoother trend line.
Momentum Analysis:
- RSI: The Relative Strength Index (RSI) has been hovering around the neutral zone, indicating a balanced momentum.
- Stochastic Oscillator: Both %K and %D have been fluctuating, suggesting indecision in momentum.
- Williams %R: The Williams %R has been oscillating in the oversold territory, indicating a potential reversal.
Volatility Analysis:
- Bollinger Bands (BB): The Bollinger Bands have been narrowing, indicating decreasing volatility.
- BB %B: The %B indicator has been fluctuating within a moderate range, reflecting stable price movements.
Volume Analysis:
- On-Balance Volume (OBV): The OBV has been negative, suggesting selling pressure in the stock.
- Chaikin Money Flow (CMF): The CMF has been negative, indicating a lack of buying interest.
Key Observations:
- The trend indicators show a potential convergence in the MACD, signaling a shift in momentum.
- Momentum indicators reflect mixed signals with RSI in a neutral zone and Williams %R in oversold territory.
- Volatility has been decreasing, indicating a possible consolidation phase.
- Volume indicators suggest selling pressure and a lack of significant buying interest.
Conclusion:
Based on the analysis of the technical indicators, the stock of MAXN is likely to experience sideways movement in the coming days. The convergence in MACD and stable EMA suggest a potential shift in momentum, while the mixed signals in momentum indicators and lack of significant buying interest indicate a period of consolidation. Additionally, decreasing volatility and negative volume indicators point towards a sideways trend with limited price fluctuations. Investors should exercise caution and closely monitor the indicators for any potential trend reversals.