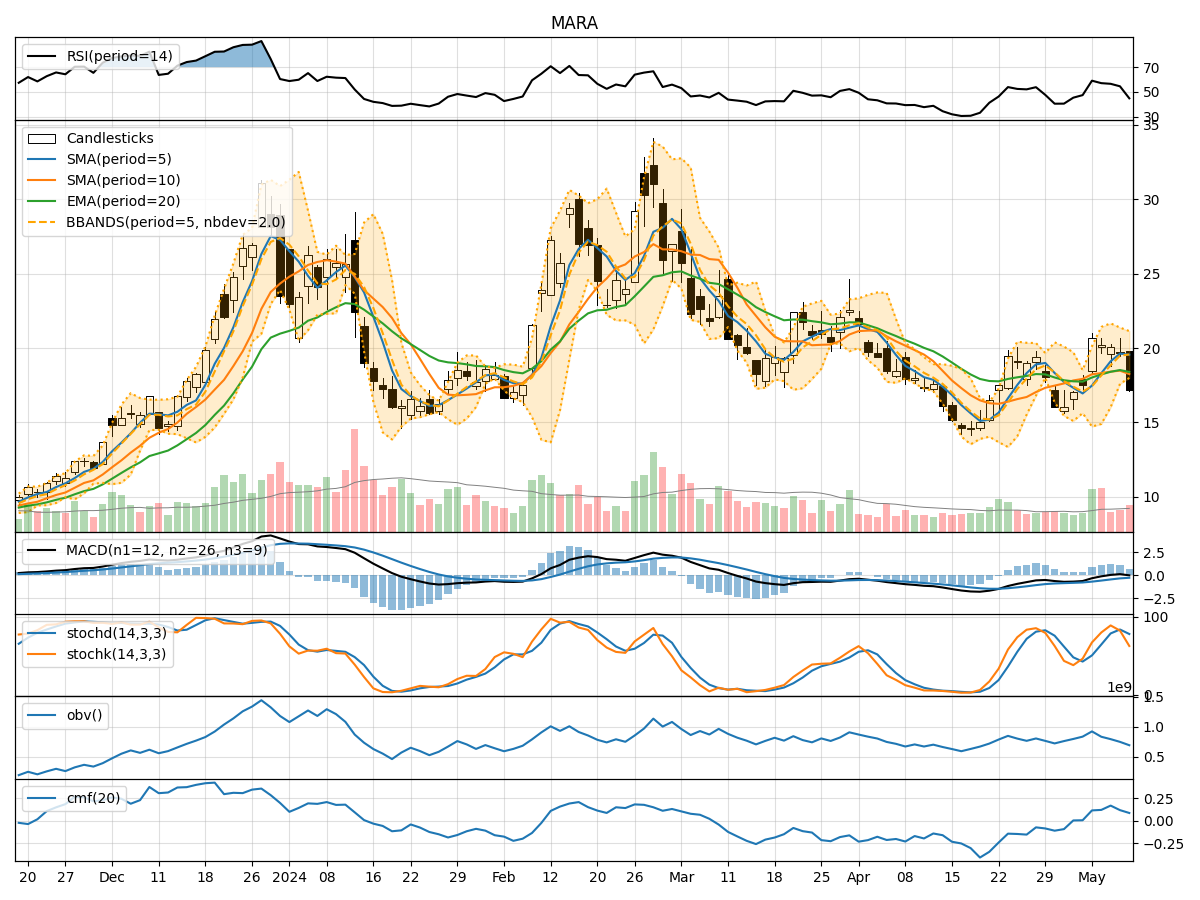
Technical Analysis of MARA 2024-05-10
Overview:
In analyzing the technical indicators for MARA over the last 5 days, we will delve into the trend, momentum, volatility, and volume indicators to provide a comprehensive outlook on the possible stock price movement. By examining these key aspects, we aim to offer valuable insights and predictions for the upcoming days.
Trend Indicators:
- Moving Averages (MA): The 5-day moving average has been consistently above the closing prices, indicating a potential bullish trend.
- MACD: The MACD line has been below the signal line, suggesting a bearish momentum in the short term.
- EMA: The exponential moving average has been trending slightly upwards, reflecting a potential bullish sentiment.
Momentum Indicators:
- RSI: The Relative Strength Index has been fluctuating around the neutral zone, indicating indecision in the market.
- Stochastic Oscillator: Both %K and %D have been declining, signaling a bearish momentum.
- Williams %R: The Williams %R is in oversold territory, suggesting a potential reversal in the short term.
Volatility Indicators:
- Bollinger Bands: The bands have been narrowing, indicating decreasing volatility and a possible period of consolidation.
- Bollinger %B: The %B indicator is close to 0, suggesting that the stock price is near the lower band, potentially indicating an oversold condition.
Volume Indicators:
- On-Balance Volume (OBV): The OBV has been declining, indicating selling pressure in the market.
- Chaikin Money Flow (CMF): The CMF has been relatively stable, suggesting a neutral money flow trend.
Key Observations and Opinions:
- Trend: The moving averages and EMA point towards a potential bullish trend, while the MACD signals a short-term bearish momentum.
- Momentum: The RSI and Stochastic Oscillator indicate mixed signals, with the Williams %R suggesting a possible reversal.
- Volatility: The narrowing Bollinger Bands and low %B value indicate a period of consolidation and potential oversold conditions.
- Volume: The declining OBV suggests selling pressure, while the stable CMF indicates a neutral money flow sentiment.
Conclusion:
Based on the analysis of the technical indicators, the next few days for MARA could see sideways movement with a slight bearish bias. Traders should exercise caution and monitor key levels such as support and resistance for potential entry or exit points. It is advisable to wait for clearer signals or confirmation of a trend before making significant trading decisions.