Technical Analysis of LYT 2024-05-10
Overview:
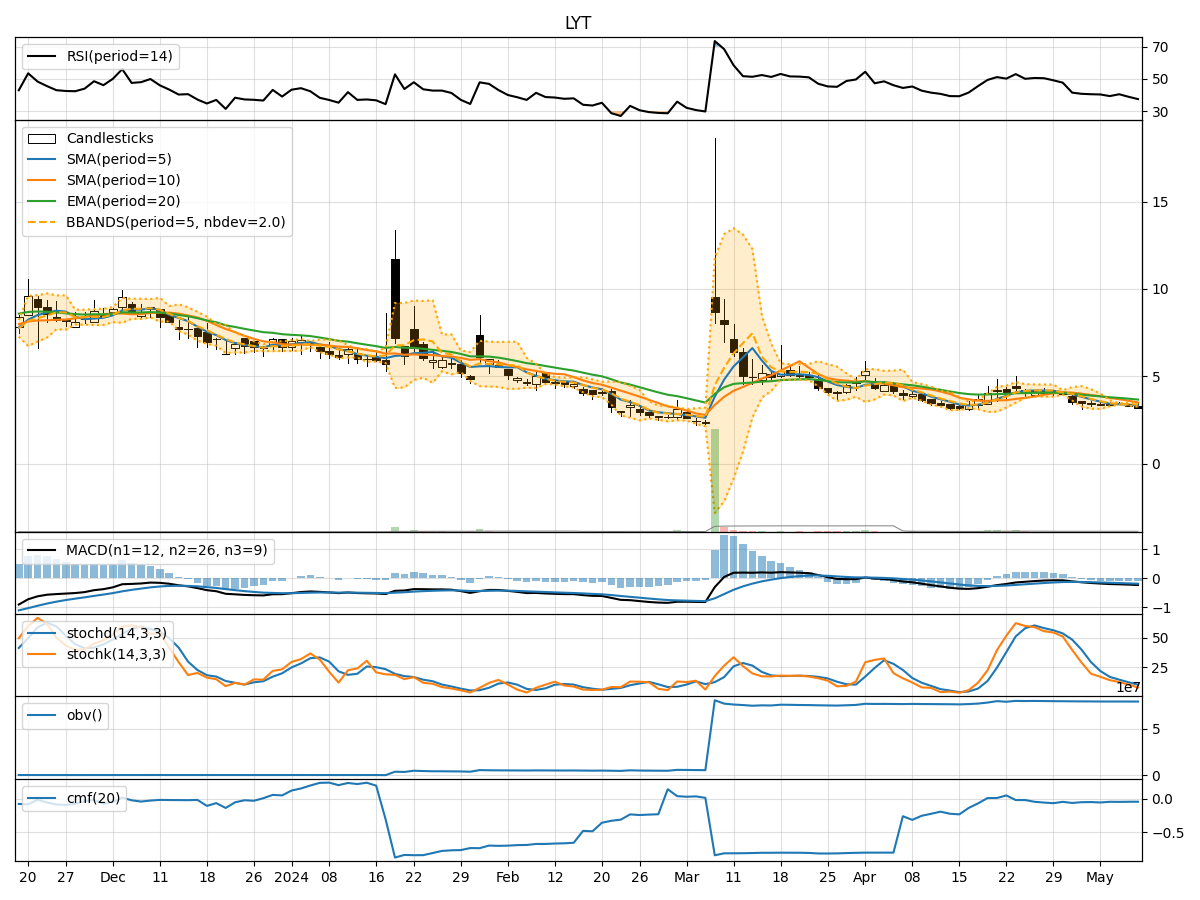
In analyzing the technical indicators for LYT stock over the last 5 days, we will delve into the trends, momentum, volatility, and volume aspects to provide a comprehensive outlook on the possible future stock price movements. By examining key indicators such as moving averages, MACD, RSI, Bollinger Bands, and OBV, we aim to offer valuable insights and predictions for the upcoming trading days.
Trend Analysis:
- Moving Averages (MA): The 5-day MA has been consistently decreasing, indicating a downward trend in the stock price.
- MACD: The MACD line has been negative and decreasing, suggesting bearish momentum in the stock.
Momentum Analysis:
- RSI: The RSI has been declining and is currently below 50, reflecting a bearish sentiment in the stock.
- Stochastic Oscillator: Both %K and %D values are decreasing, signaling a potential continuation of the downward momentum.
Volatility Analysis:
- Bollinger Bands (BB): The stock price has been trading below the lower Bollinger Band, indicating oversold conditions.
Volume Analysis:
- On-Balance Volume (OBV): The OBV has been decreasing, suggesting that selling pressure has been dominant in the stock.
Key Observations:
- The stock is in a clear downtrend based on moving averages and MACD.
- Momentum indicators like RSI and Stochastic Oscillator confirm the bearish sentiment in the stock.
- Volatility indicators show that the stock is currently oversold based on Bollinger Bands.
- The decreasing OBV indicates selling pressure in the stock.
Conclusion:
Based on the technical analysis of the trend, momentum, volatility, and volume indicators, the outlook for LYT stock in the next few days is bearish. The stock is likely to continue its downward trajectory, with potential for further price declines. Traders and investors should exercise caution and consider short-term strategies to capitalize on the bearish momentum.