Technical Analysis of LVTX 2024-05-10
Overview:
In analyzing the technical indicators for LVTX over the last 5 days, we will delve into the trend, momentum, volatility, and volume indicators to provide a comprehensive outlook on the possible stock price movement in the coming days. By examining these key aspects, we aim to offer valuable insights and predictions for potential investors.
Trend Analysis:
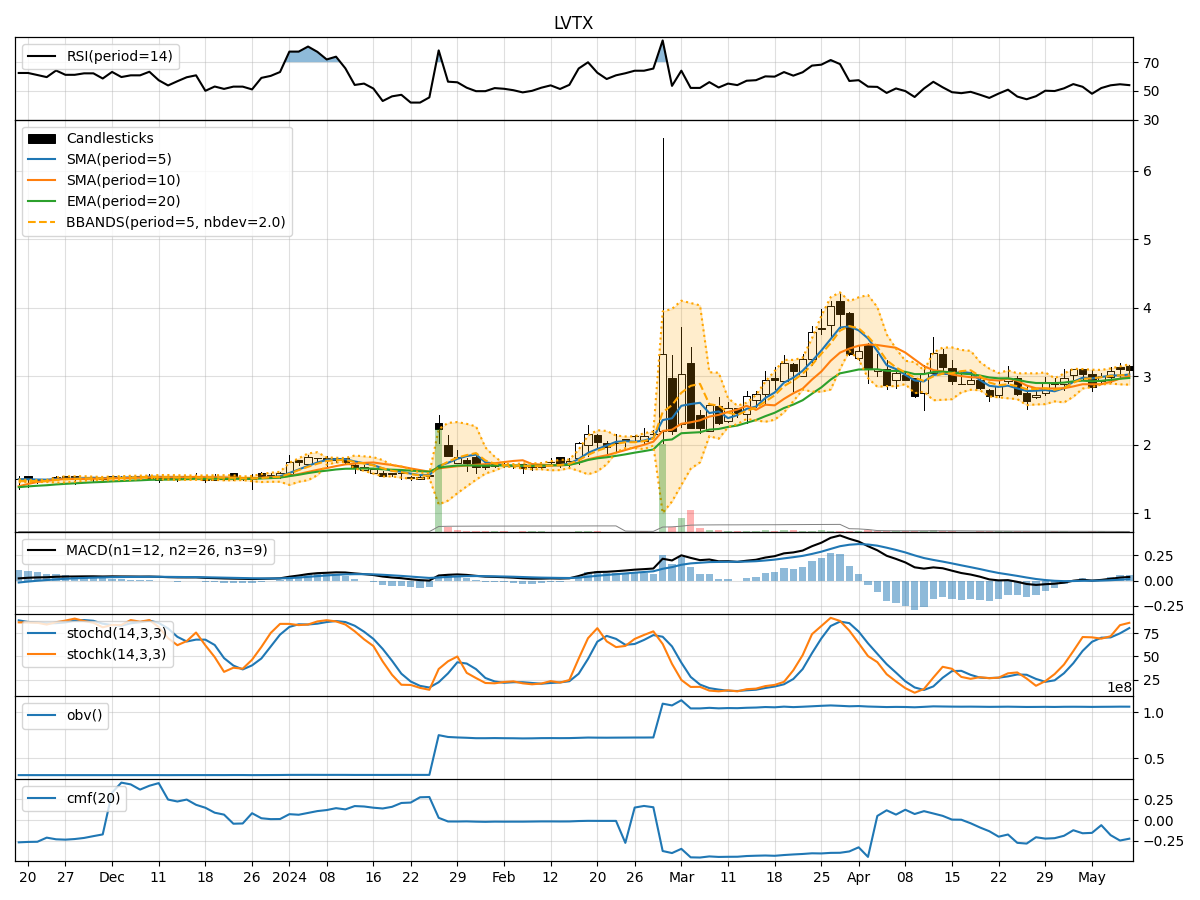
- Moving Averages (MA): The 5-day Moving Average (MA) has been steadily increasing, indicating a positive trend in the stock price.
- MACD: The MACD line has been consistently above the signal line, suggesting bullish momentum in the stock.
- EMA: The Exponential Moving Average (EMA) has been on an upward trajectory, supporting the bullish sentiment in the stock.
Key Observation: The trend indicators point towards an upward trend in the stock price.
Momentum Analysis:
- RSI: The Relative Strength Index (RSI) has been gradually increasing but remains below the overbought threshold of 70, indicating room for further upside.
- Stochastic Oscillator: Both %K and %D lines of the Stochastic Oscillator are in the overbought zone, suggesting potential overextension in the short term.
- Williams %R: The Williams %R is in the oversold territory, indicating a possible reversal in the stock price.
Key Observation: The momentum indicators signal a mixed sentiment with potential for a short-term pullback.
Volatility Analysis:
- Bollinger Bands: The stock price has been trading within the Bollinger Bands, with the bands widening slightly, indicating increased volatility.
- Bollinger %B: The %B indicator is hovering around the middle range, suggesting a neutral stance in terms of volatility.
Key Observation: Volatility is increasing, which could lead to larger price swings in the near future.
Volume Analysis:
- On-Balance Volume (OBV): The OBV has been relatively stable, indicating a balance between buying and selling pressure.
- Chaikin Money Flow (CMF): The CMF has been negative, suggesting outflow of money from the stock.
Key Observation: The volume indicators reflect a neutral sentiment with no clear direction in buying or selling pressure.
Conclusion:
Based on the analysis of the technical indicators, the stock of LVTX is likely to experience upward price movement in the coming days, supported by the positive trend indicators. However, the mixed momentum signals and increasing volatility suggest the possibility of a short-term pullback or consolidation before resuming the upward trend. It is essential for investors to closely monitor the price action and key levels to make informed trading decisions.
Recommendation:
- Short-term Traders: Consider taking profits or setting tight stop-loss orders to manage potential downside risks.
- Long-term Investors: Hold onto positions with a focus on the overall bullish trend but remain vigilant for any signs of reversal in momentum indicators.
By staying informed and adapting to changing market conditions, investors can navigate the fluctuations in LVTX stock price effectively.