Technical Analysis of LVRO 2024-05-10
Overview:
In analyzing the technical indicators for LVRO over the last 5 days, we will delve into the trend, momentum, volatility, and volume indicators to provide a comprehensive assessment of the stock's potential price movement. By examining these key factors, we aim to offer valuable insights and predictions for the next few days.
Trend Analysis:
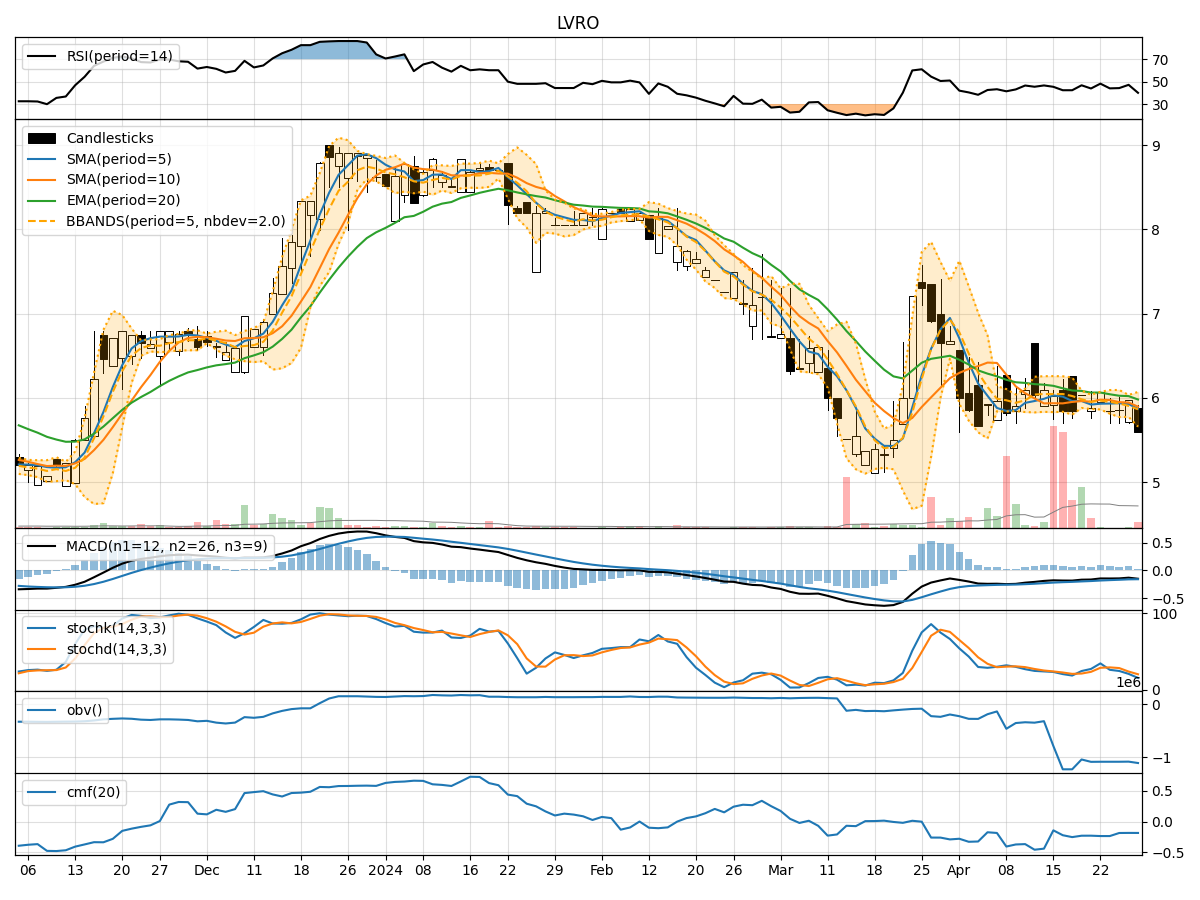
- Moving Averages (MA): The 5-day Moving Average (MA) has been fluctuating around the closing prices, indicating a lack of clear trend direction.
- MACD: The Moving Average Convergence Divergence (MACD) has been consistently negative, suggesting a bearish momentum in the short term.
- EMA: The Exponential Moving Average (EMA) has been declining, further supporting the bearish sentiment in the stock.
Key Observation: The trend indicators point towards a bearish outlook for LVRO in the short term.
Momentum Analysis:
- RSI: The Relative Strength Index (RSI) has been hovering around the mid-range, indicating a neutral momentum.
- Stochastic Oscillator: Both %K and %D have shown mixed signals, with no clear indication of overbought or oversold conditions.
- Williams %R: The Williams %R is in the oversold territory, suggesting a potential reversal in the stock's momentum.
Key Observation: The momentum indicators suggest a neutral to slightly bearish momentum for LVRO.
Volatility Analysis:
- Bollinger Bands: The Bollinger Bands have been narrowing, indicating decreasing volatility in the stock.
- Bollinger %B: The %B indicator is below 0.5, suggesting the stock is trading below the lower Bollinger Band.
- Average True Range (ATR): The ATR has been decreasing, reflecting reduced price volatility.
Key Observation: Volatility indicators signal a decreasing volatility environment for LVRO.
Volume Analysis:
- On-Balance Volume (OBV): The OBV has been consistently negative, indicating a higher selling pressure in the stock.
- Chaikin Money Flow (CMF): The CMF is negative, suggesting outflow of money from the stock over the analyzed period.
Key Observation: Volume indicators point towards increased selling pressure in LVRO.
Conclusion:
Based on the analysis of trend, momentum, volatility, and volume indicators, the overall outlook for LVRO in the next few days is bearish. The trend indicators, momentum signals, and volume analysis all align to suggest a potential downward movement in the stock price. The decreasing volatility further supports the likelihood of a continued bearish trend.
Key Conclusion: The next few days are likely to see a downward movement in LVRO's stock price. Investors should exercise caution and consider potential shorting opportunities based on the technical analysis provided.