Technical Analysis of LRCX 2024-05-10
Overview:
In analyzing the technical indicators for LRCX over the last 5 days, we will delve into the trend, momentum, volatility, and volume indicators to provide a comprehensive outlook on the possible stock price movement in the coming days.
Trend Analysis:
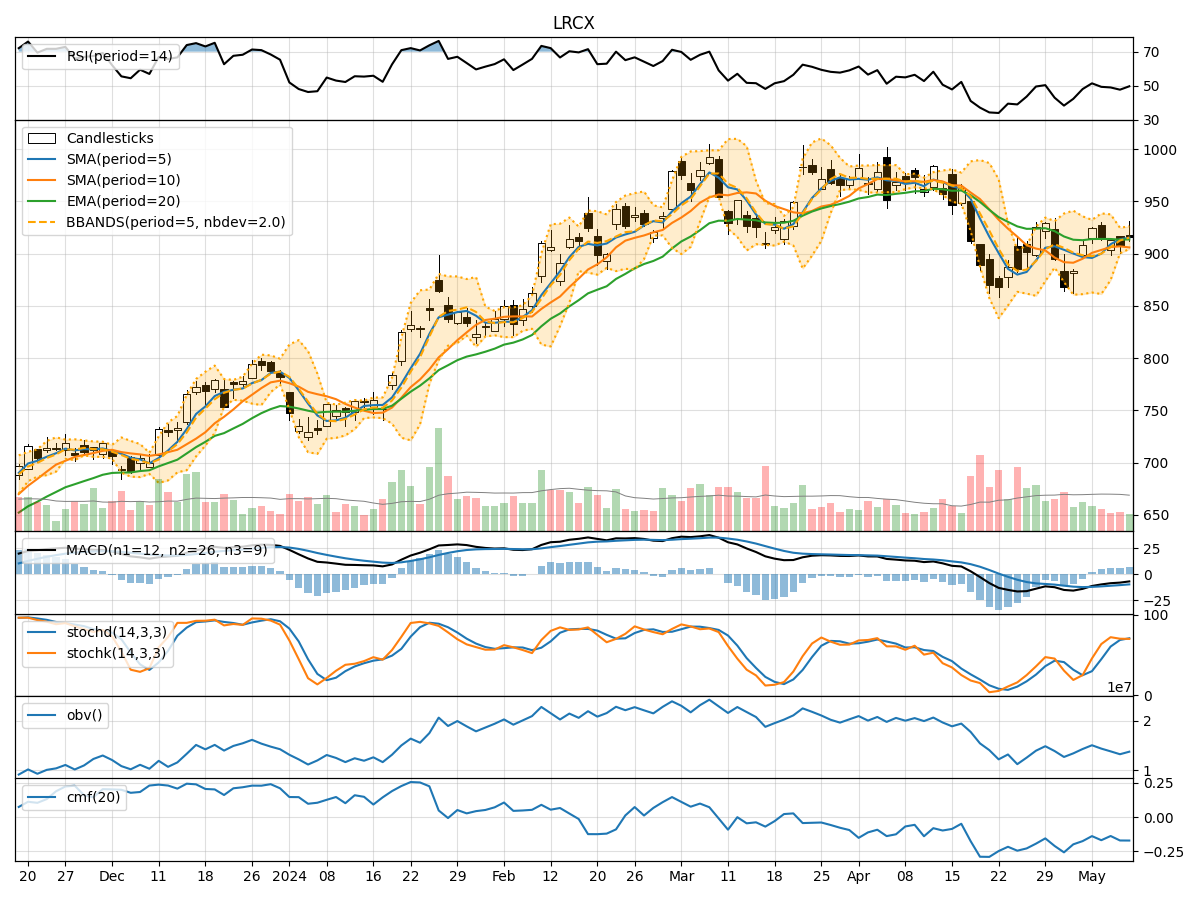
- Moving Averages (MA): The 5-day Moving Average (MA) has been consistently above the Simple Moving Average (SMA) and Exponential Moving Average (EMA) over the past 5 days, indicating a bullish trend.
- MACD: The MACD line has been consistently above the signal line, with both lines showing an upward trend, suggesting bullish momentum.
Momentum Analysis:
- RSI: The Relative Strength Index (RSI) has been fluctuating around the 50 level, indicating a lack of strong momentum in either direction.
- Stochastic Oscillator: Both %K and %D lines of the Stochastic Oscillator have been in the overbought zone, suggesting a potential reversal in the short term.
Volatility Analysis:
- Bollinger Bands (BB): The stock price has been trading within the Bollinger Bands, with the bands narrowing, indicating decreasing volatility.
Volume Analysis:
- On-Balance Volume (OBV): The OBV has been declining over the past 5 days, suggesting a bearish sentiment among traders.
- Chaikin Money Flow (CMF): The CMF has been negative, indicating selling pressure in the market.
Conclusion:
Based on the analysis of the technical indicators, the stock of LRCX is currently in a consolidation phase with a slight bearish bias. The trend indicators suggest a bullish sentiment, while the momentum indicators point towards a potential short-term reversal. The volatility is decreasing, indicating a possible period of consolidation, and the volume indicators reflect a bearish sentiment among traders.
Forecast:
Considering the mixed signals from the indicators, it is likely that LRCX will continue to trade in a sideways pattern in the coming days. Traders should exercise caution and wait for clearer signals before taking any significant positions.