Technical Analysis of LGO 2024-05-10
Overview:
In analyzing the technical indicators for LGO over the last 5 days, we will delve into the trend, momentum, volatility, and volume indicators to provide a comprehensive outlook on the possible stock price movement in the coming days. By examining these key aspects, we aim to offer valuable insights and predictions for potential investors and traders.
Trend Analysis:
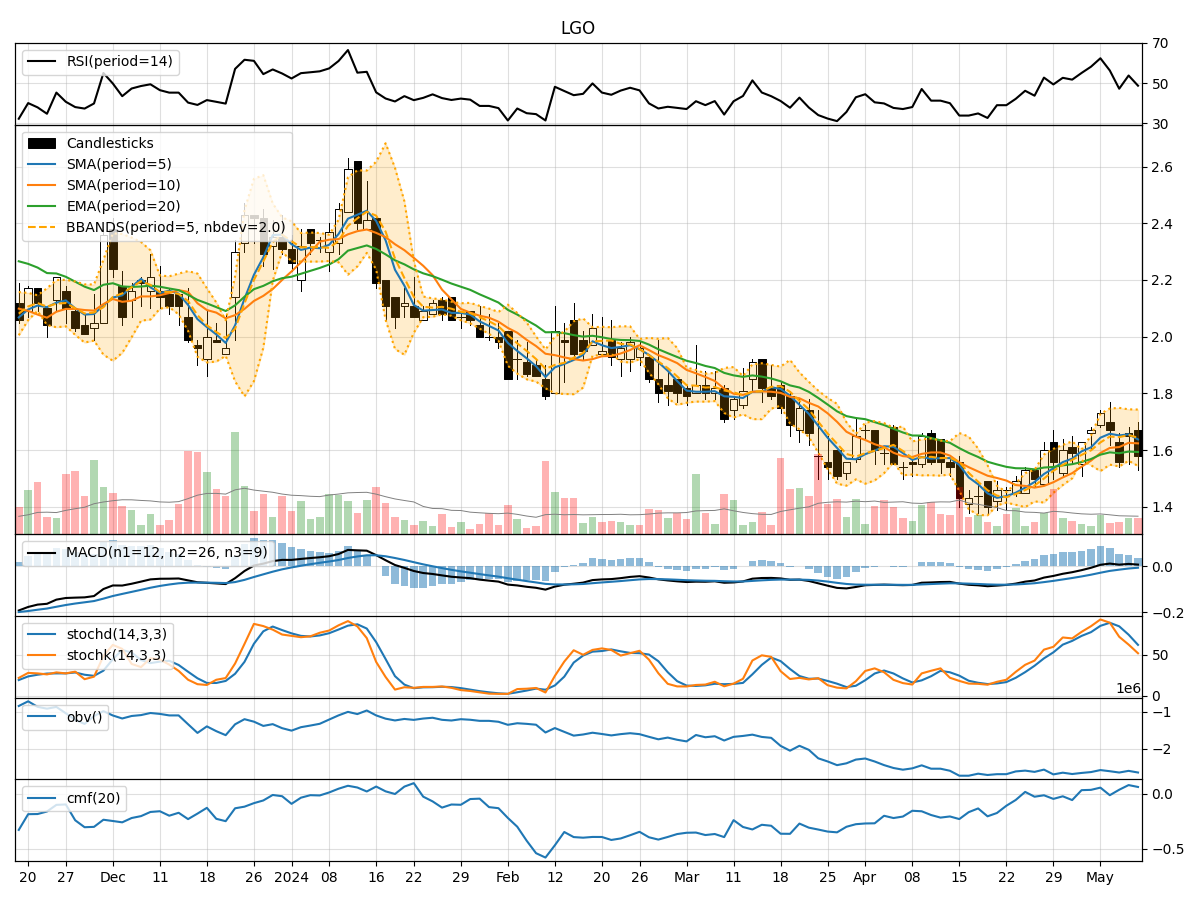
- Moving Averages (MA): The 5-day Moving Average (MA) has been fluctuating around the closing prices, indicating short-term price trends. The Simple Moving Average (SMA) and Exponential Moving Average (EMA) show a slight upward trend, suggesting a potential bullish sentiment.
- MACD: The Moving Average Convergence Divergence (MACD) and its signal line (MACDH) have been positive, albeit with decreasing values. This could signal a weakening bullish momentum.
Momentum Analysis:
- RSI: The Relative Strength Index (RSI) has been oscillating around the neutral 50 level, indicating a lack of strong momentum in either direction.
- Stochastic Oscillator: Both %K and %D levels of the Stochastic Oscillator have been declining, suggesting a potential bearish momentum.
Volatility Analysis:
- Bollinger Bands (BB): The Bollinger Bands have been narrowing, indicating decreasing volatility. The bands are currently close to the price, suggesting a potential breakout in either direction.
Volume Analysis:
- On-Balance Volume (OBV): The OBV has been fluctuating, indicating indecision among market participants regarding the stock.
- Chaikin Money Flow (CMF): The CMF has been positive, indicating potential buying pressure in the market.
Key Observations:
- The trend indicators show a mixed signal with a slight bullish bias.
- Momentum indicators suggest a lack of strong momentum, leaning towards a bearish sentiment.
- Volatility indicators point towards a potential breakout due to decreasing volatility.
- Volume indicators reflect indecision among market participants, with a slight buying pressure.
Conclusion:
Based on the analysis of the technical indicators, the next few days' possible stock price movement for LGO could be sideways with a slight bearish bias. Investors should closely monitor the price action for a potential breakout from the current consolidation phase. It is advisable to wait for a clear trend confirmation before making any significant trading decisions.