Technical Analysis of LGHL 2024-05-10
Overview:
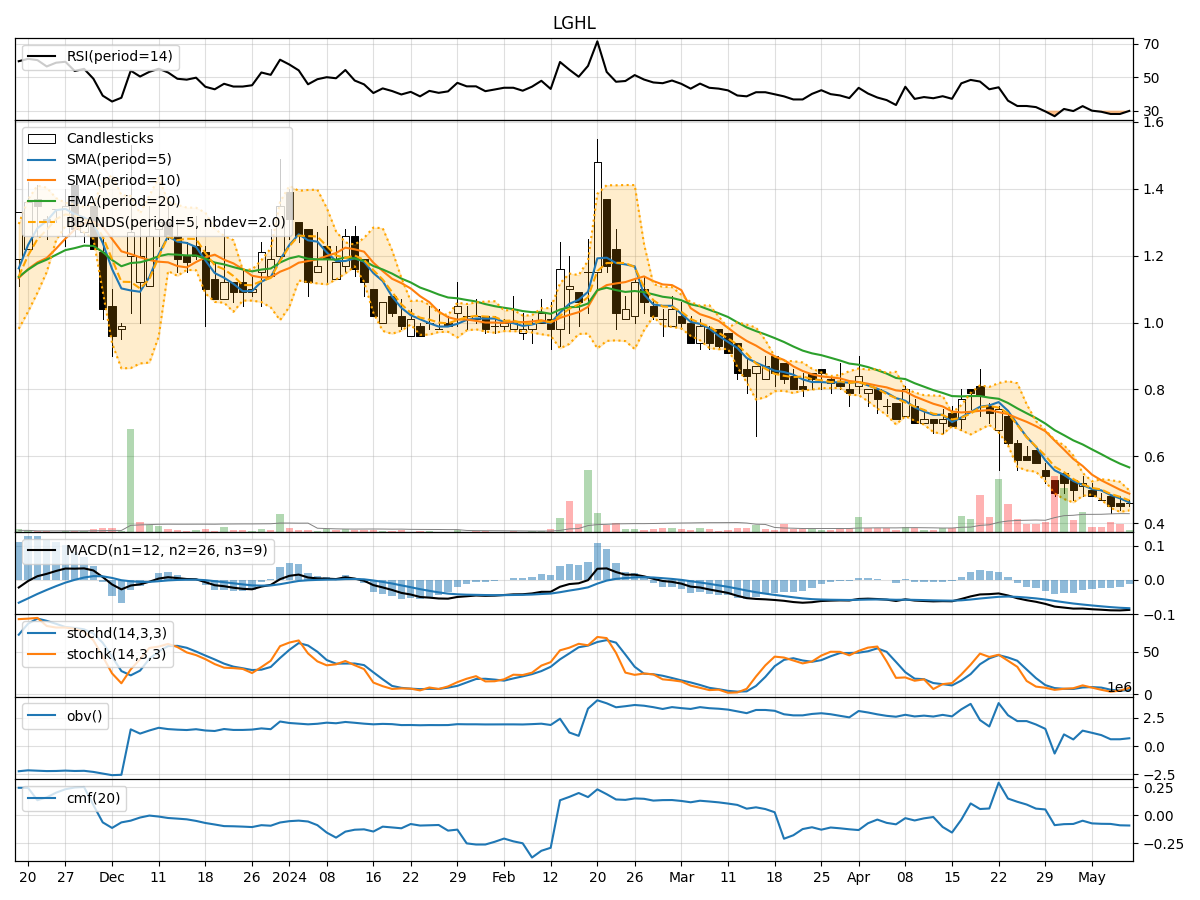
In analyzing the technical indicators for LGHL over the last 5 days, we will delve into the trends, momentum, volatility, and volume indicators to provide a comprehensive outlook on the possible stock price movement in the coming days. By examining key metrics such as moving averages, MACD, RSI, Bollinger Bands, and OBV, we aim to offer valuable insights and predictions for potential investors.
Trend Indicators:
- Moving Averages (MA): The 5-day MA has been consistently declining, indicating a bearish trend in the short term.
- MACD: The MACD line has been negative and decreasing, suggesting a bearish momentum.
- EMA: The EMA(20) is also on a downward trajectory, reinforcing the bearish sentiment in the stock.
Momentum Indicators:
- RSI: The RSI has been in the oversold territory, reflecting a strong bearish momentum.
- Stochastic Oscillator: Both %K and %D have been decreasing, indicating a bearish trend.
- Williams %R: The indicator has been in the oversold region, signaling a potential reversal or continuation of the downtrend.
Volatility Indicators:
- Bollinger Bands: The stock price has been trading below the lower Bollinger Band, suggesting oversold conditions and a possible bounce back.
- Bollinger %B: The %B is below 0.2, indicating a potential oversold situation.
- Bollinger Band Width: The band width has widened, indicating increased volatility in the stock price.
Volume Indicators:
- On-Balance Volume (OBV): The OBV has been consistently declining, suggesting a bearish sentiment among investors.
- Chaikin Money Flow (CMF): The CMF(20) has been negative, indicating selling pressure in the stock.
Key Observations:
- The stock is currently in a strong bearish trend based on the moving averages, MACD, and EMA indicators.
- Momentum indicators such as RSI and Stochastic Oscillator confirm the oversold conditions and bearish sentiment.
- Volatility indicators suggest that the stock is currently experiencing increased volatility and potential for a reversal.
- The declining OBV and negative CMF indicate selling pressure and lack of buying interest in the stock.
Conclusion:
Based on the analysis of the technical indicators, the next few days are likely to see a continuation of the bearish trend in LGHL. Investors should exercise caution as the stock is currently oversold and may experience a short-term bounce back due to increased volatility. However, the overall outlook remains bearish until there is a significant shift in the technical indicators towards a more positive trend. It is advisable to closely monitor the price action and key indicators for any potential reversal signals before considering any buying opportunities.