Technical Analysis of LGCL 2024-05-10
Overview:
In analyzing the technical indicators for LGCL stock over the last 5 days, we will delve into the trends, momentum, volatility, and volume indicators to provide a comprehensive outlook on the possible stock price movement in the coming days. By examining these key indicators, we aim to offer valuable insights and predictions to guide investment decisions.
Trend Analysis:
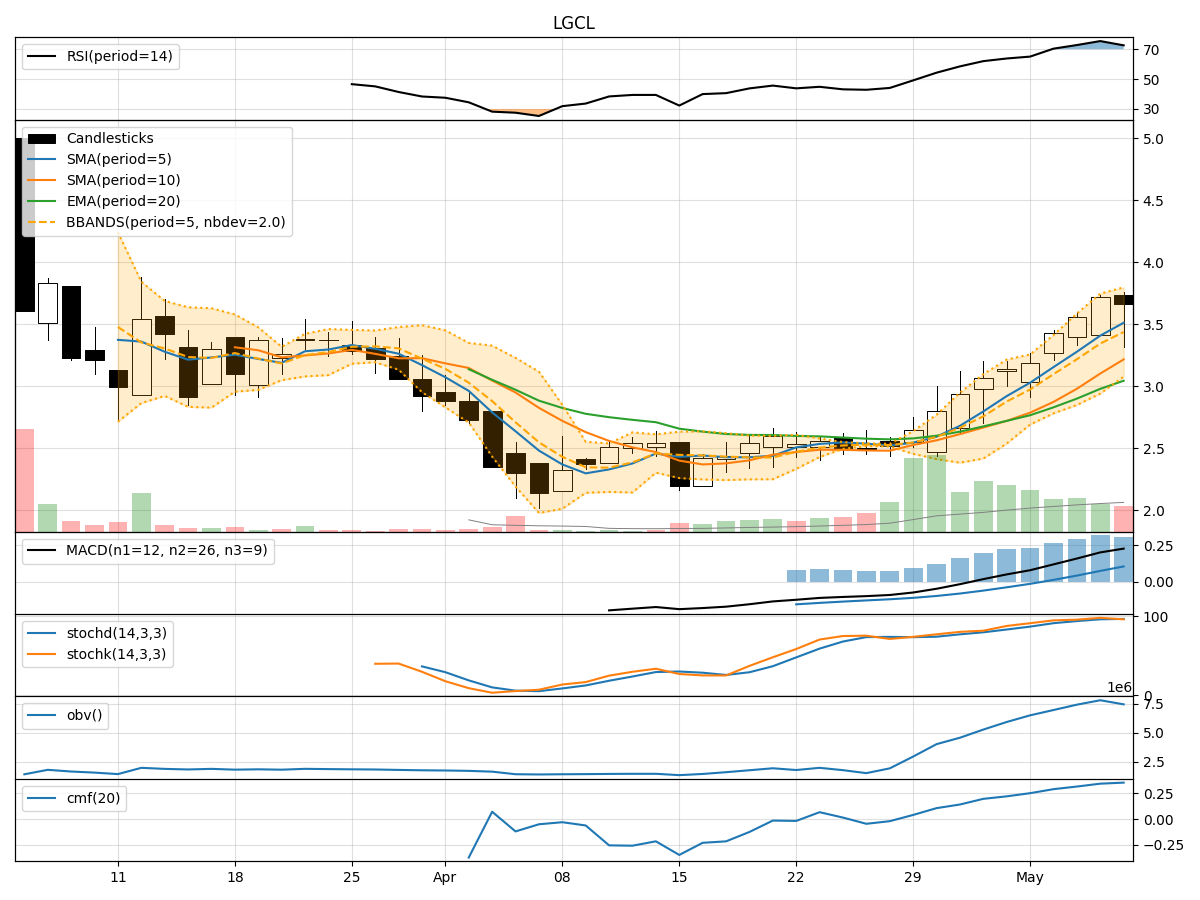
- Moving Averages (MA): The 5-day Moving Average (MA) has been consistently above the Simple Moving Average (SMA) and Exponential Moving Average (EMA), indicating a bullish trend.
- MACD: The MACD line has been consistently above the signal line, suggesting a bullish momentum in the stock price.
Key Observation: The trend indicators point towards a bullish sentiment in the stock price movement.
Momentum Analysis:
- RSI: The Relative Strength Index (RSI) has been consistently above 70, indicating an overbought condition but also reflecting strong buying momentum.
- Stochastic Oscillator: Both %K and %D lines of the Stochastic Oscillator have been in the overbought zone, suggesting a strong upward momentum.
Key Observation: The momentum indicators signal a strong bullish sentiment in the stock price movement.
Volatility Analysis:
- Bollinger Bands (BB): The stock price has been trading within the upper Bollinger Band (BBU), indicating high volatility and potential overbought conditions.
Key Observation: The volatility indicators suggest a high volatility environment in the stock price.
Volume Analysis:
- On-Balance Volume (OBV): The OBV has been steadily increasing over the last 5 days, indicating strong buying pressure and accumulation of the stock.
- Chaikin Money Flow (CMF): The CMF has been consistently positive, reflecting strong buying activity in the stock.
Key Observation: The volume indicators point towards strong buying pressure and accumulation in the stock.
Conclusion:
Based on the analysis of the technical indicators, the LGCL stock is exhibiting a strong bullish sentiment across trend, momentum, and volume indicators. The high volatility indicated by the Bollinger Bands suggests potential overbought conditions, but the overall trend and momentum remain strongly bullish.
Forecast:
Given the current technical outlook, it is likely that the LGCL stock will continue its upward trajectory in the coming days. Traders and investors may consider capitalizing on the bullish momentum but should also be cautious of potential pullbacks due to high volatility. It is advisable to closely monitor the price action and key support levels for any signs of reversal.
Disclaimer:
This analysis is based solely on technical indicators and historical data. It is essential to consider other fundamental factors and market dynamics before making any investment decisions. Consulting with a financial advisor or conducting further research is recommended to ensure informed decision-making.