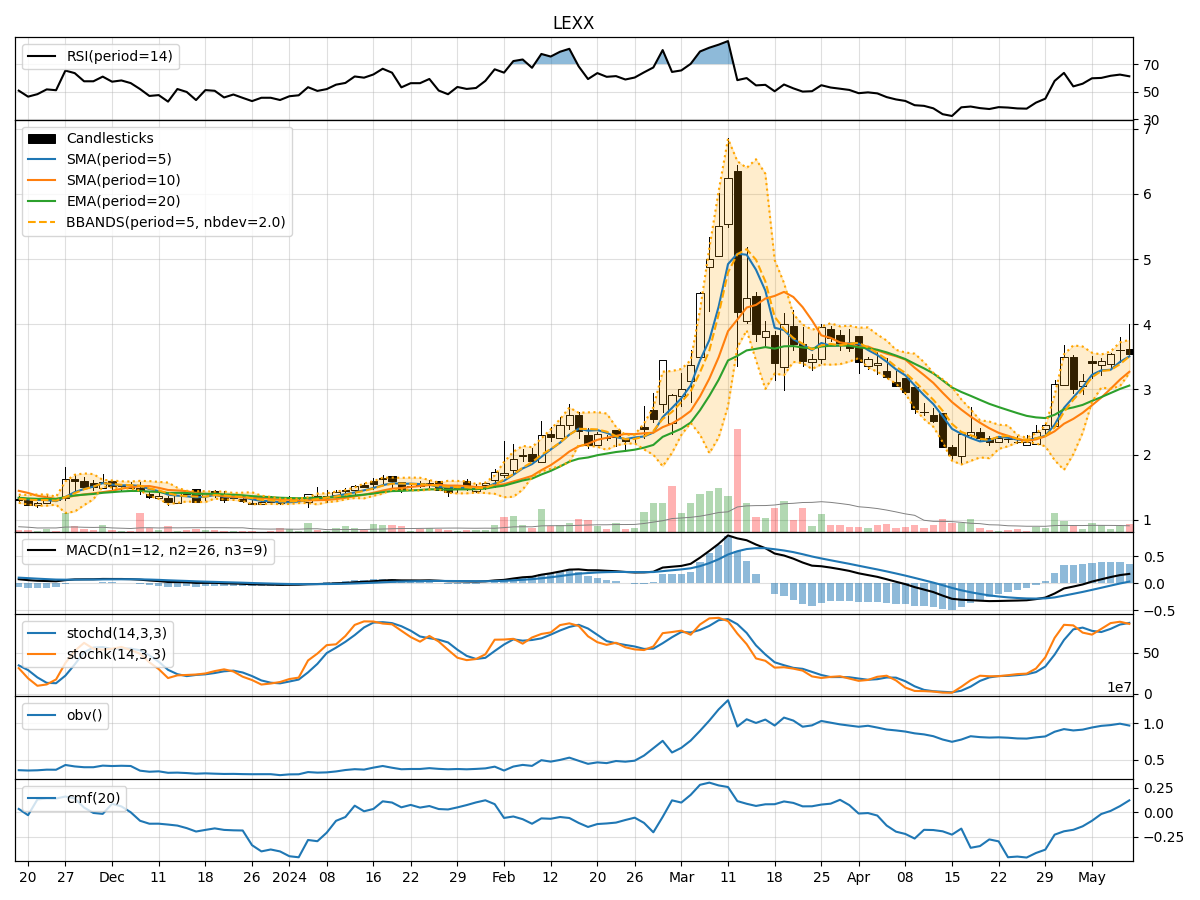
Technical Analysis of LEXX 2024-05-10
Overview:
In analyzing the technical indicators for LEXX stock over the last 5 days, we will delve into the trend, momentum, volatility, and volume indicators to provide a comprehensive outlook on the possible stock price movement in the coming days.
Trend Indicators:
- Moving Averages (MA): The 5-day Moving Average has been consistently above the closing prices, indicating an upward trend.
- MACD: The MACD line has been positive and increasing, while the MACD Histogram has been mostly positive, suggesting bullish momentum.
Momentum Indicators:
- RSI: The Relative Strength Index has been fluctuating around the neutral zone, indicating indecision in the market.
- Stochastic Oscillator: Both %K and %D have been in overbought territory, signaling a potential reversal.
Volatility Indicators:
- Bollinger Bands: The stock price has been mostly within the bands, with the %B indicator showing fluctuations but staying above 0.5, indicating bullish momentum.
Volume Indicators:
- On-Balance Volume (OBV): The OBV has been increasing, suggesting accumulation by investors.
- Chaikin Money Flow (CMF): The CMF has been positive, indicating buying pressure in the market.
Key Observations:
- The trend indicators suggest a strong bullish sentiment with the moving averages and MACD signaling upward momentum.
- Momentum indicators show a mixed picture with RSI indicating neutrality and Stochastic Oscillator hinting at a potential reversal.
- Volatility indicators point towards a relatively stable price movement within the Bollinger Bands.
- Volume indicators reflect positive accumulation and buying pressure in the market.
Conclusion:
Based on the analysis of the technical indicators, the next few days' possible stock price movement for LEXX is likely to be upward. The bullish trend indicated by moving averages and MACD, coupled with positive volume indicators, suggests a potential continuation of the upward momentum. However, caution is advised as the Stochastic Oscillator signals overbought conditions, and RSI indicates a neutral stance. Traders should monitor the price action closely for any signs of a reversal.