Technical Analysis of LDTC 2024-05-10
Overview:
In analyzing the technical indicators for LDTC over the last 5 days, we will delve into the trends, momentum, volatility, and volume aspects to provide a comprehensive outlook on the possible stock price movement. By examining key indicators such as moving averages, MACD, RSI, Bollinger Bands, and OBV, we aim to offer valuable insights and predictions for the upcoming days.
Trend Analysis:
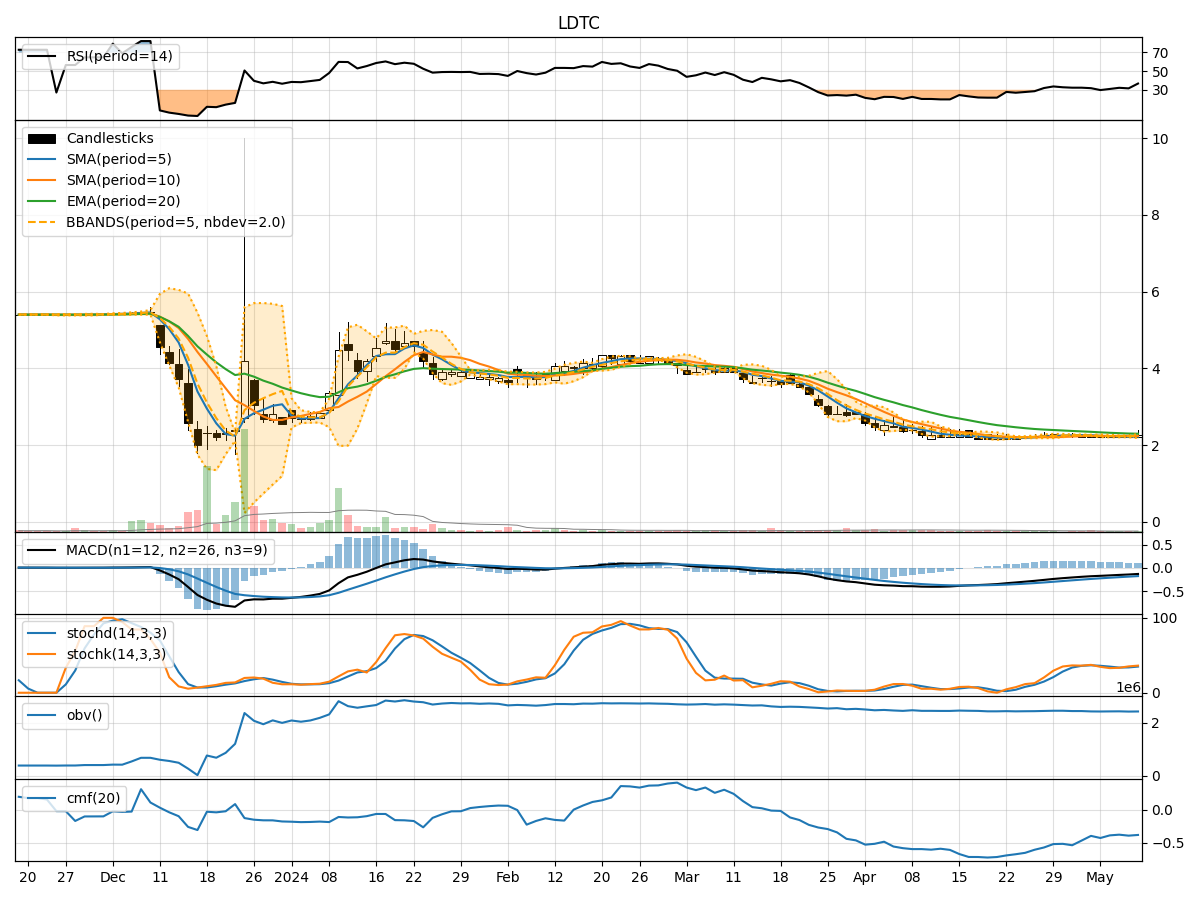
- Moving Averages (MA): The 5-day MA has been gradually decreasing from 2.240 to 2.218, indicating a short-term downtrend.
- MACD: The MACD line has been consistently negative, suggesting bearish momentum in the stock price.
- EMA: The EMA has also been declining, further supporting the bearish trend.
Key Observation: The trend indicators point towards a downward trajectory in the stock price.
Momentum Analysis:
- RSI: The RSI values have been relatively low, indicating oversold conditions in the market.
- Stochastic Oscillator: Both %K and %D values have been fluctuating around mid-levels, reflecting indecision among traders.
- Williams %R: The Williams %R values have been hovering in the oversold territory, signaling a potential reversal.
Key Observation: The momentum indicators suggest a possible reversal or sideways movement in the stock price.
Volatility Analysis:
- Bollinger Bands: The stock price has been trading within the lower Bollinger Band, indicating oversold conditions.
- Bollinger Band Width: The BBW has been relatively narrow, suggesting low volatility in the market.
Key Observation: Volatility indicators imply a potential consolidation phase or sideways movement in the stock price.
Volume Analysis:
- On-Balance Volume (OBV): The OBV values have been negative, indicating distribution of the stock.
- Chaikin Money Flow (CMF): The CMF values have been consistently negative, reflecting selling pressure.
Key Observation: Volume indicators signal bearish sentiment and selling pressure in the market.
Conclusion:
Based on the analysis of trend, momentum, volatility, and volume indicators, the next few days' possible stock price movement for LDTC is likely to be downward in the short term. The bearish trend indicated by moving averages and MACD, coupled with oversold conditions in momentum indicators, suggests a potential continuation of the current downtrend. Additionally, the negative OBV and CMF values point towards sustained selling pressure in the market.
Overall Assessment: The stock is expected to experience a bearish trend in the upcoming days, with a possibility of further decline in the stock price. Traders and investors should exercise caution and consider risk management strategies in light of the prevailing market dynamics.