Technical Analysis of LBTYK 2024-05-10
Overview:
In analyzing the technical indicators for LBTYK over the last 5 days, we will delve into the trend, momentum, volatility, and volume indicators to provide a comprehensive outlook on the possible stock price movement in the coming days. By examining these key aspects, we aim to offer valuable insights and predictions for potential investors.
Trend Analysis:
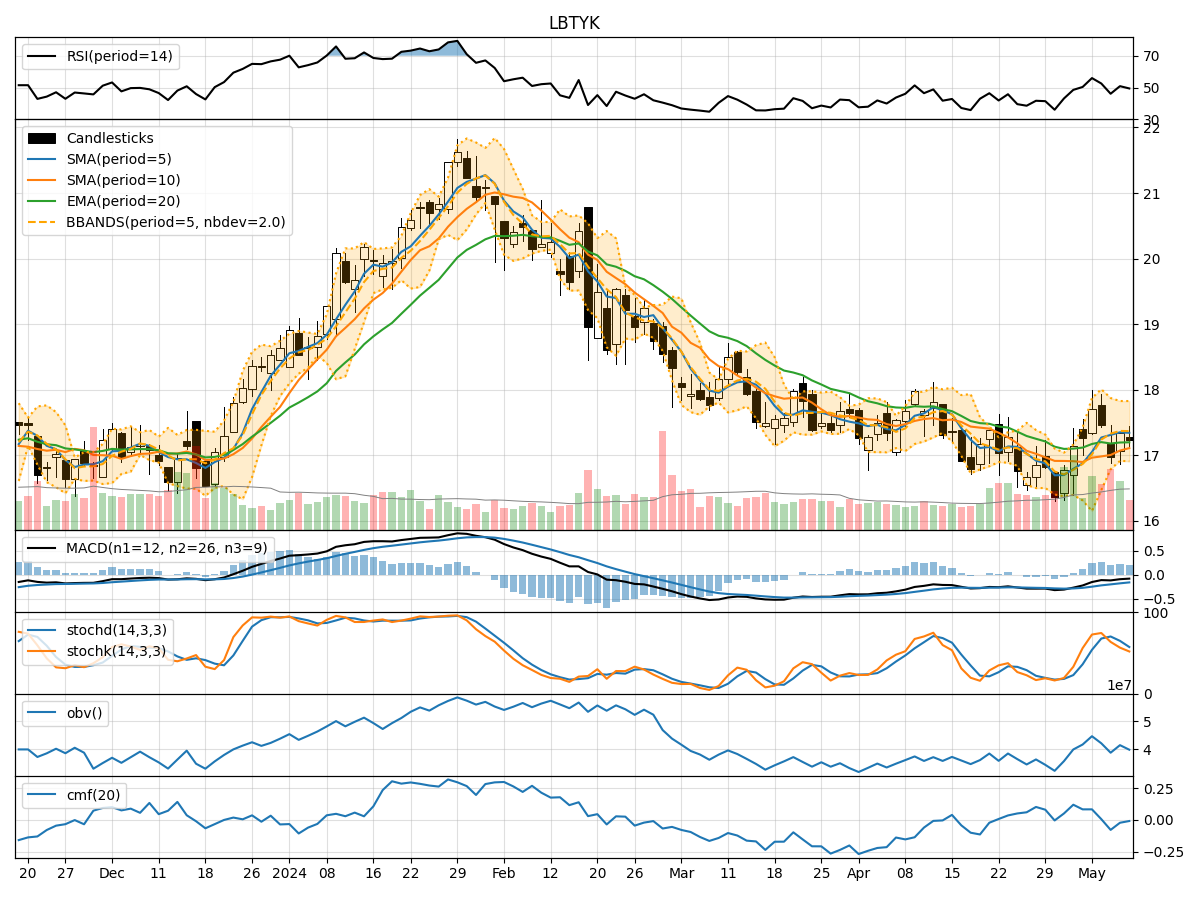
- Moving Averages (MA): The 5-day Moving Average (MA) has been fluctuating around the closing prices, indicating short-term price trends. The Simple Moving Average (SMA) and Exponential Moving Average (EMA) show a slight downward trend, suggesting a bearish sentiment.
- Moving Average Convergence Divergence (MACD): The MACD line has been consistently below the signal line, indicating a bearish trend in the stock price.
- Conclusion: The trend indicators suggest a bearish outlook for LBTYK in the near term.
Momentum Analysis:
- Relative Strength Index (RSI): The RSI values have been hovering around the mid-level, indicating a neutral momentum in the stock.
- Stochastic Oscillator: Both %K and %D values have been declining, suggesting a weakening momentum.
- Williams %R (WillR): The Williams %R is in the oversold territory, indicating a potential reversal in the stock price.
- Conclusion: The momentum indicators signal a neutral to bearish momentum for LBTYK.
Volatility Analysis:
- Bollinger Bands (BB): The Bollinger Bands have been narrowing, indicating decreasing volatility in the stock price.
- Conclusion: The volatility indicators suggest a decreasing volatility in LBTYK, potentially leading to a period of consolidation.
Volume Analysis:
- On-Balance Volume (OBV): The OBV values have been negative, indicating a higher selling pressure in the stock.
- Chaikin Money Flow (CMF): The CMF values are negative, suggesting a bearish money flow in the stock.
- Conclusion: The volume indicators point towards increased selling pressure and bearish sentiment in LBTYK.
Overall Conclusion:
Based on the analysis of trend, momentum, volatility, and volume indicators, the overall outlook for LBTYK in the next few days is bearish. The trend indicators show a downward trend, momentum indicators suggest a neutral to bearish sentiment, volatility is decreasing, and volume indicators indicate increased selling pressure. Therefore, it is likely that LBTYK may experience a downward movement in the coming days.
Recommendation:
Investors should exercise caution and consider potential short-term bearish movements in LBTYK. It may be prudent to wait for more positive signals or confirmation of a trend reversal before considering any long positions. Monitoring key support levels and waiting for a clear uptrend confirmation could provide better entry points for potential investors.