Technical Analysis of LBTYB 2024-05-10
Overview:
In analyzing the technical indicators for LBTYB over the last 5 days, we will delve into the trend, momentum, volatility, and volume indicators to provide a comprehensive outlook on the possible stock price movement in the coming days. By examining these key aspects, we aim to offer valuable insights and predictions to guide investment decisions.
Trend Analysis:
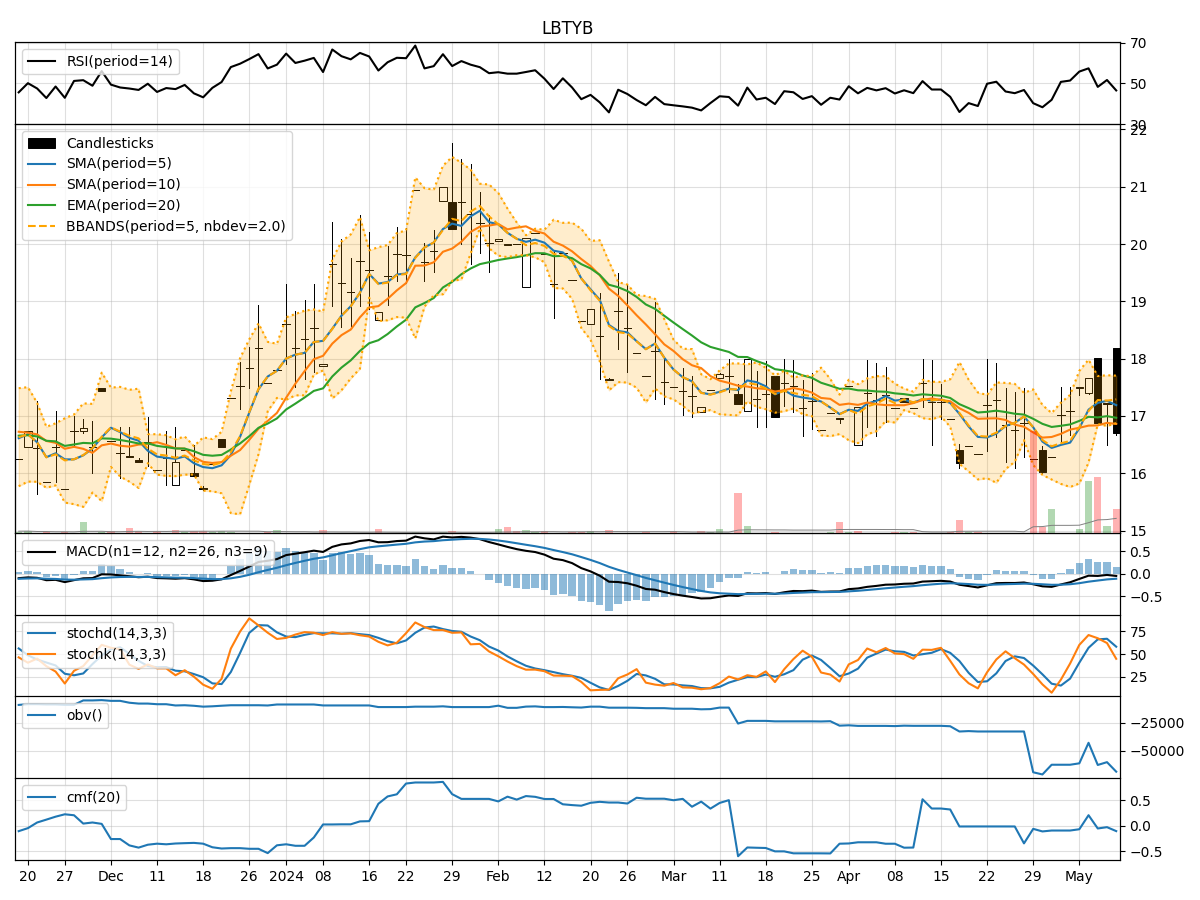
- Moving Averages (MA): The 5-day MA has been fluctuating around the closing prices, indicating short-term price trends. The SMA(10) and EMA(20) have shown slight variations but have not provided a clear trend direction.
- MACD: The MACD line has been consistently below the signal line, suggesting a bearish momentum in the stock price.
- Conclusion: The trend indicators point towards a bearish sentiment in the short term.
Momentum Analysis:
- RSI: The RSI has been hovering around the 50 level, indicating a neutral momentum in the stock.
- Stochastic Oscillator: Both %K and %D have shown mixed signals, with no clear indication of overbought or oversold conditions.
- Conclusion: The momentum indicators suggest a neutral stance with no strong directional bias.
Volatility Analysis:
- Bollinger Bands (BB): The stock price has been trading within the bands, with no significant breaches indicating volatility.
- Conclusion: Volatility remains stable with no extreme price movements expected.
Volume Analysis:
- On-Balance Volume (OBV): The OBV has been fluctuating, indicating mixed buying and selling pressure.
- Chaikin Money Flow (CMF): The CMF has been negative, suggesting a slight distribution phase.
- Conclusion: Volume indicators reflect mixed sentiment with no clear accumulation or distribution pattern.
Overall Conclusion:
Based on the analysis of trend, momentum, volatility, and volume indicators, the stock price of LBTYB is likely to experience further downward movement in the coming days. The bearish trend indicated by the MACD, coupled with the neutral momentum and mixed volume signals, suggests a lack of strong buying interest to support a reversal. Traders should exercise caution and consider short-term selling opportunities or wait for a clearer trend confirmation before entering new positions.
Key Recommendations:
- Short-Term Traders: Consider short-selling or staying on the sidelines until a clear trend emerges.
- Long-Term Investors: Monitor the price action closely and wait for a more favorable entry point.
- Risk Management: Implement stop-loss orders to protect against potential downside risks.
- Market Monitoring: Stay updated on news and events that could impact the stock price movement.
In conclusion, the technical analysis indicates a bearish outlook for LBTYB in the near term. It is essential for investors to conduct further research and consider multiple factors before making any investment decisions.