Technical Analysis of KRNT 2024-05-10
Overview:
In analyzing the technical indicators for KRNT over the last 5 days, we will delve into the trend, momentum, volatility, and volume indicators to provide a comprehensive outlook on the possible stock price movement in the coming days. By examining these key indicators, we aim to offer valuable insights and predictions for informed decision-making.
Trend Analysis:
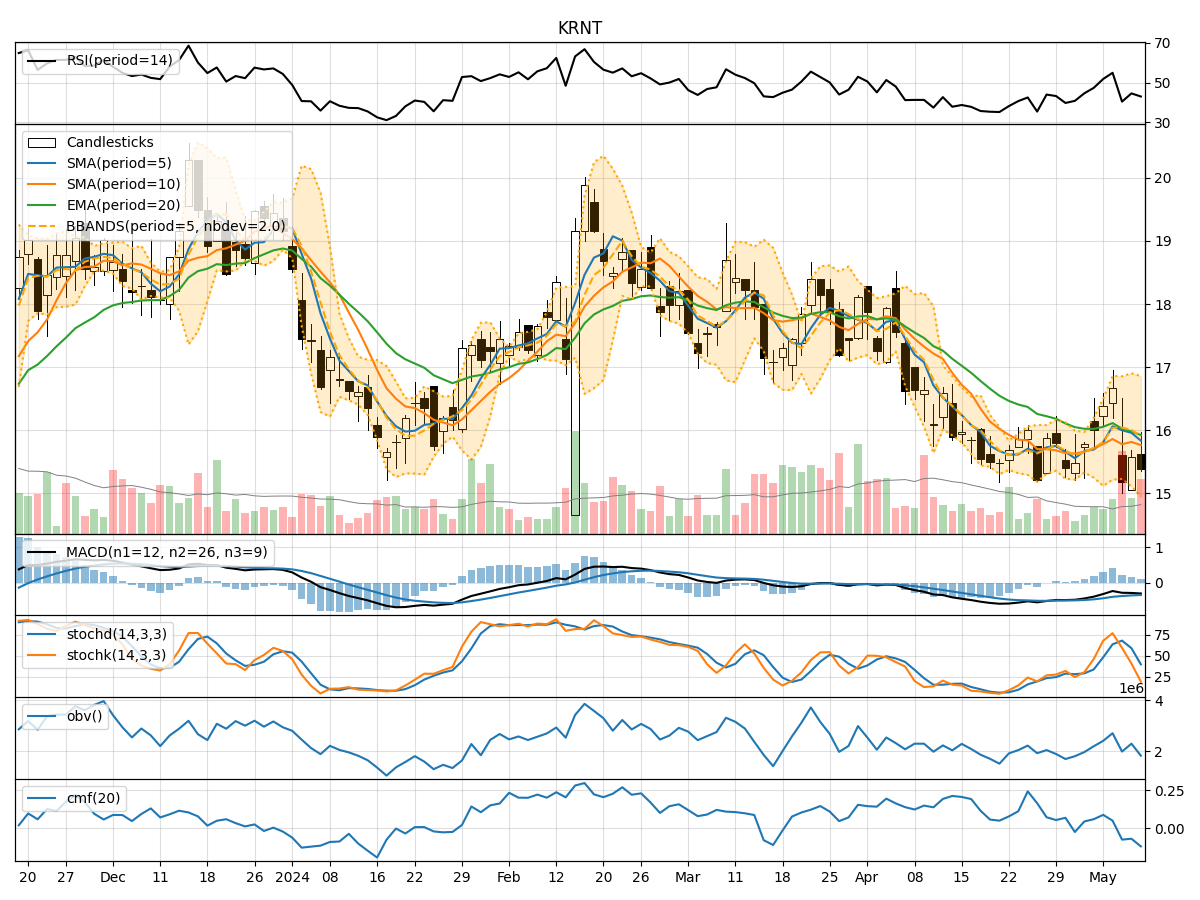
- Moving Averages (MA): The 5-day Moving Average (MA) has been fluctuating around the closing prices, indicating short-term price trends. The Simple Moving Average (SMA) and Exponential Moving Average (EMA) show a mixed trend, with the EMA slightly above the SMA.
- MACD: The Moving Average Convergence Divergence (MACD) has been negative, suggesting a bearish momentum in the stock price. The MACD Histogram (MACDH) has been decreasing, indicating a weakening bearish trend.
Momentum Analysis:
- RSI: The Relative Strength Index (RSI) has been hovering around the neutral zone, indicating a lack of strong momentum in either direction.
- Stochastic Oscillator: Both %K and %D of the Stochastic Oscillator have been declining, signaling a bearish momentum in the stock.
- Williams %R: The Williams %R is in the oversold territory, suggesting a potential reversal or consolidation phase.
Volatility Analysis:
- Bollinger Bands (BB): The Bollinger Bands have been narrowing, indicating decreasing volatility in the stock price. The %B indicator is below 1, suggesting the price is below the upper band.
- Average True Range (ATR): The ATR has been decreasing, reflecting lower volatility in the stock.
Volume Analysis:
- On-Balance Volume (OBV): The OBV has been fluctuating, indicating mixed buying and selling pressure in the stock.
- Chaikin Money Flow (CMF): The CMF has been negative, suggesting outflow of money from the stock.
Conclusion:
Based on the analysis of the technical indicators, the stock of KRNT is currently in a bearish phase. The trend indicators show a weakening bearish trend, while momentum indicators signal a lack of strong momentum. Volatility is decreasing, indicating a potential consolidation phase, and volume indicators reflect mixed buying and selling pressure.
Forecast:
In the next few days, we can expect the stock price of KRNT to continue its downward trajectory, with a possibility of further consolidation or sideways movement. Traders and investors should exercise caution and consider waiting for clearer signals before making any significant trading decisions.