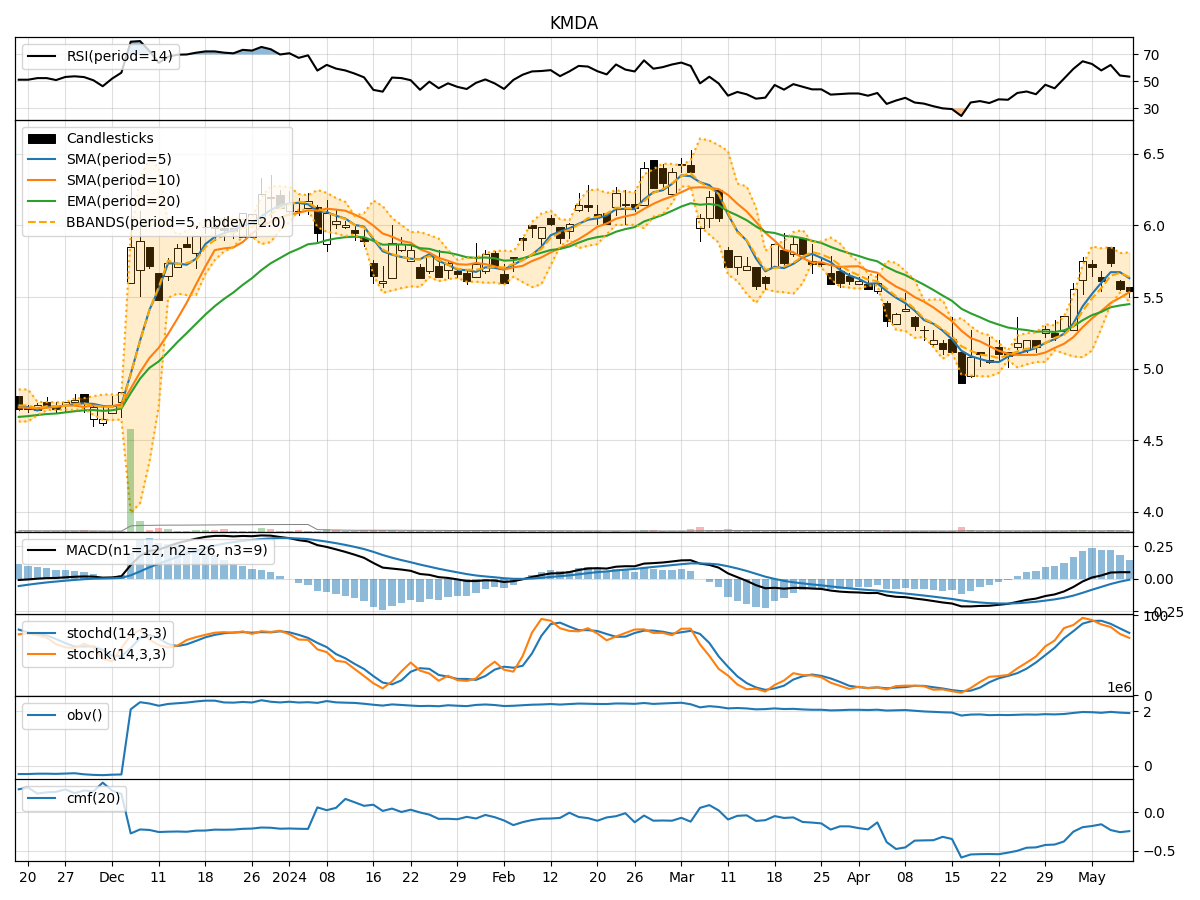
Technical Analysis of KMDA 2024-05-10
Overview:
In analyzing the technical indicators for KMDA over the last 5 days, we will delve into the trend, momentum, volatility, and volume indicators to provide a comprehensive outlook on the possible stock price movement. By examining these key aspects, we aim to offer valuable insights and recommendations for potential investors.
Trend Indicators:
- Moving Averages (MA): The 5-day Moving Average (MA) has been fluctuating around the current price, indicating short-term price stability.
- MACD: The Moving Average Convergence Divergence (MACD) has shown a slight positive trend, suggesting a potential bullish momentum.
- EMA: The Exponential Moving Average (EMA) has been gradually increasing, reflecting a positive price trend.
Momentum Indicators:
- RSI: The Relative Strength Index (RSI) has been oscillating around the neutral zone, indicating a lack of strong momentum.
- Stochastic Oscillator: Both %K and %D have been declining, signaling a potential bearish momentum.
- Williams %R: The Williams %R is in the oversold territory, suggesting a possible reversal in the short term.
Volatility Indicators:
- Bollinger Bands: The Bollinger Bands have been narrowing, indicating decreasing volatility and a potential price breakout.
- Bollinger %B: The %B indicator is hovering around the middle range, suggesting a balanced market sentiment.
Volume Indicators:
- On-Balance Volume (OBV): The OBV has been declining, indicating selling pressure in the market.
- Chaikin Money Flow (CMF): The CMF has been negative, reflecting a lack of buying interest and potential bearish sentiment.
Key Observations and Opinions:
- Trend: The trend indicators suggest a mixed outlook with a slight bullish bias due to the positive MACD and EMA trends.
- Momentum: Momentum indicators indicate a lack of strong momentum, with the Stochastic Oscillator showing a bearish bias.
- Volatility: Volatility indicators point towards a potential breakout as the Bollinger Bands narrow.
- Volume: Volume indicators reflect selling pressure and a lack of buying interest in the market.
Conclusion:
Based on the analysis of the technical indicators, the next few days for KMDA stock price movement could see sideways consolidation with a slight bearish bias. Investors should exercise caution and closely monitor key support and resistance levels for potential entry or exit points. It is advisable to wait for more definitive signals before making significant trading decisions.