Technical Analysis of KHC 2024-05-10
Overview:
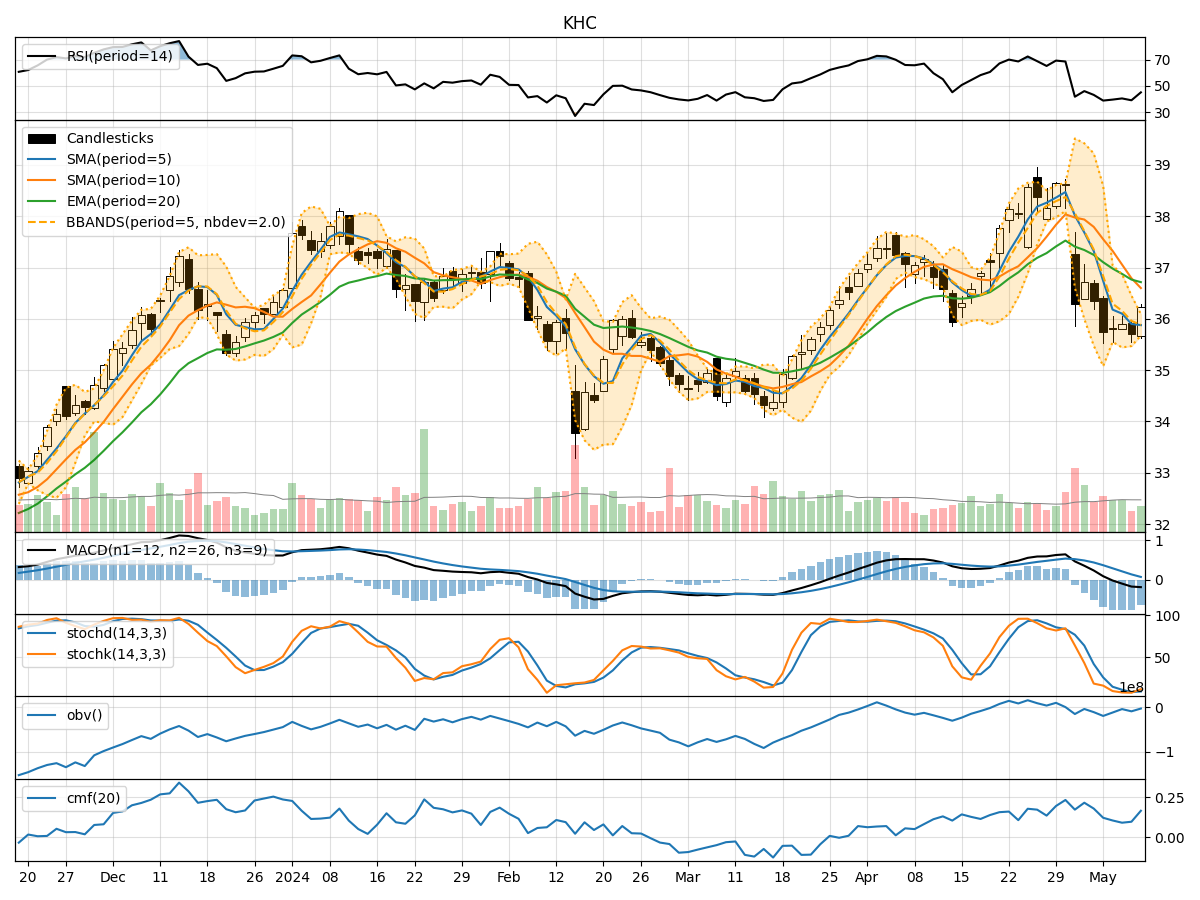
In analyzing the technical indicators for KHC over the last 5 days, we will delve into the trend, momentum, volatility, and volume indicators to provide a comprehensive outlook on the possible stock price movement in the coming days.
Trend Analysis:
- Moving Averages (MA): The 5-day Moving Average (MA) is below the Simple Moving Average (SMA) and Exponential Moving Average (EMA), indicating a downward trend.
- MACD: The MACD line is below the signal line, suggesting a bearish trend.
- Conclusion: The trend indicators point towards a downward movement in the stock price.
Momentum Analysis:
- RSI: The Relative Strength Index (RSI) is below 50, indicating bearish momentum.
- Stochastic Oscillator: Both %K and %D are below 20, signaling oversold conditions.
- Conclusion: Momentum indicators suggest a bearish sentiment in the market.
Volatility Analysis:
- Bollinger Bands (BB): The stock price is currently trading below the lower Bollinger Band, indicating oversold conditions.
- Conclusion: Volatility indicators suggest a potential reversal in the stock price.
Volume Analysis:
- On-Balance Volume (OBV): The OBV is showing a mixed trend, with no clear direction.
- Chaikin Money Flow (CMF): The CMF is positive but relatively low, indicating some buying pressure.
- Conclusion: Volume indicators are inconclusive, suggesting uncertainty in market sentiment.
Overall Conclusion:
Based on the analysis of trend, momentum, volatility, and volume indicators, the overall outlook for KHC in the next few days is bearish. The trend indicators, momentum signals, and volume analysis all point towards a potential continuation of the downward movement in the stock price. However, the volatility indicators hint at a possible reversal or consolidation in the near term.
Recommendation:
Considering the bearish trend and momentum, investors should exercise caution and consider waiting for more clarity in the market before making any significant trading decisions. It is advisable to closely monitor the price action and key support levels for potential entry or exit points. Additionally, keeping an eye on any news or fundamental developments that could impact the stock price is crucial in making informed investment choices.
Disclaimer:
Remember that technical analysis is not foolproof and should be used in conjunction with other forms of analysis and risk management strategies. Market conditions can change rapidly, so it is essential to stay informed and adapt to new information accordingly. Consulting with a financial advisor or conducting further research is recommended before making any investment decisions.