Technical Analysis of JZXN 2024-05-10
Overview:
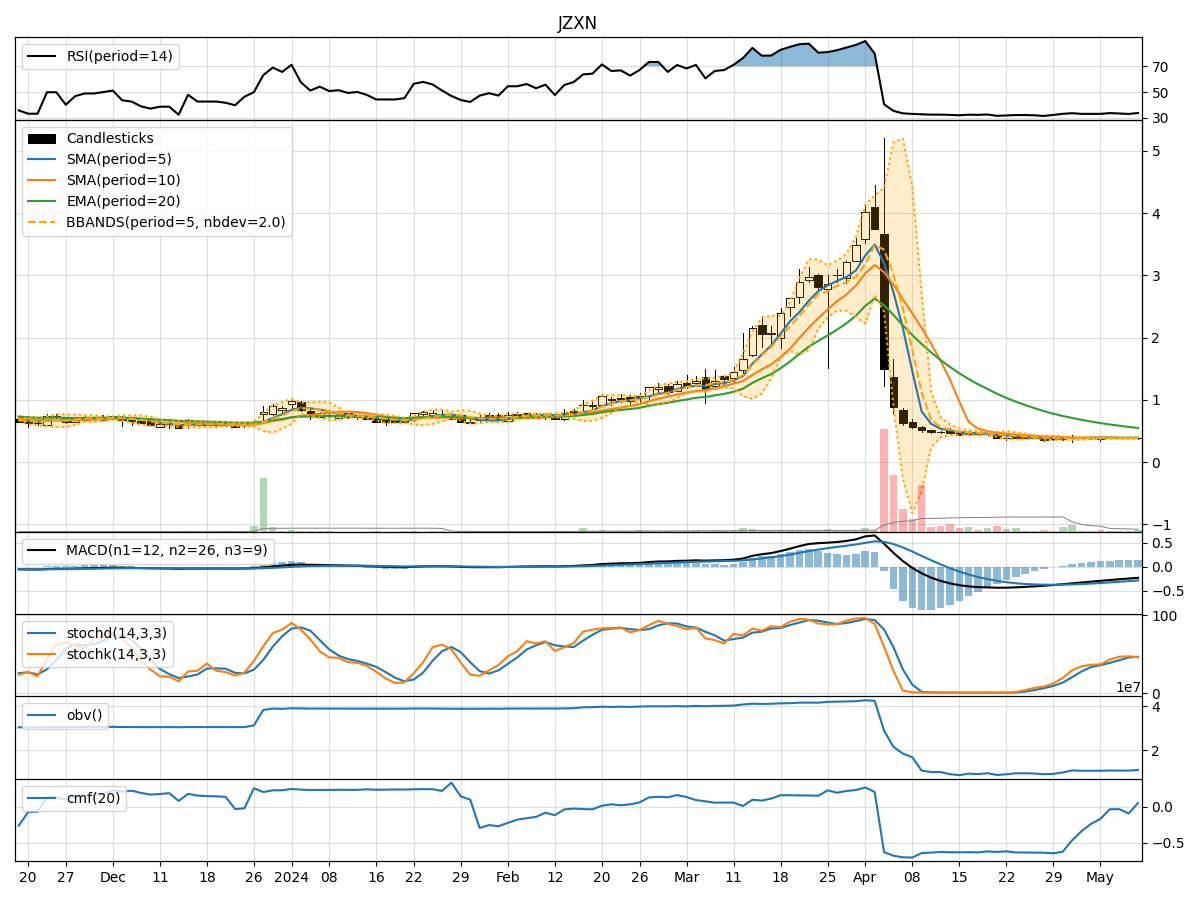
In analyzing the technical indicators for JZXN stock over the last 5 days, we will delve into the trend, momentum, volatility, and volume indicators to provide a comprehensive outlook on the possible future stock price movement. By examining these key indicators, we aim to offer valuable insights and recommendations for potential investors.
Trend Analysis:
- Moving Averages (MA): The 5-day MA has been hovering around the closing prices, indicating a short-term trend. The SMA(10) and EMA(20) show a downward trend, suggesting a bearish sentiment in the medium to long term.
- MACD: The MACD line has been negative, with the MACD histogram showing a slight increase over the last 5 days. This indicates a potential reversal in the short-term trend.
- Conclusion: The trend indicators suggest a bearish sentiment in the medium to long term, but a potential short-term reversal based on the MACD.
Momentum Analysis:
- RSI: The RSI values have been relatively low, indicating oversold conditions in the market.
- Stochastic Oscillator: Both %K and %D have been fluctuating around the overbought territory, suggesting a potential reversal in the momentum.
- Conclusion: The momentum indicators imply a potential reversal in the oversold conditions, signaling a short-term bullish momentum.
Volatility Analysis:
- Bollinger Bands (BB): The stock price has been trading within the lower Bollinger Band, indicating a period of low volatility.
- Conclusion: The volatility indicators suggest a consolidation phase with low volatility in the stock price.
Volume Analysis:
- On-Balance Volume (OBV): The OBV values have been decreasing over the last 5 days, indicating a divergence between price and volume.
- Chaikin Money Flow (CMF): The CMF has been negative, reflecting selling pressure in the market.
- Conclusion: The volume indicators suggest a bearish sentiment with selling pressure in the market.
Overall Conclusion:
Based on the analysis of the trend, momentum, volatility, and volume indicators, the next few days' possible stock price movement for JZXN is likely to be sideways with a short-term bullish bias. While the trend indicators point towards a bearish sentiment in the medium to long term, the momentum indicators suggest a potential short-term bullish momentum. The low volatility and selling pressure indicated by volume indicators further support a sideways movement with a slight upward bias.
Recommendation:
Considering the mixed signals from the technical indicators, investors should exercise caution and closely monitor the price action in the coming days. It is advisable to wait for confirmation of a sustained bullish momentum before considering any long positions. Additionally, keeping an eye on key support and resistance levels can help in making informed trading decisions.
In conclusion, the overall outlook for JZXN stock in the next few days leans towards a sideways movement with a short-term bullish bias, subject to confirmation from price action and further market developments.