Technical Analysis of JYD 2024-05-10
Overview:
In analyzing the technical indicators for JYD stock over the last 5 days, we will delve into the trends, momentum, volatility, and volume indicators to provide a comprehensive outlook on the possible stock price movement in the coming days.
Trend Analysis:
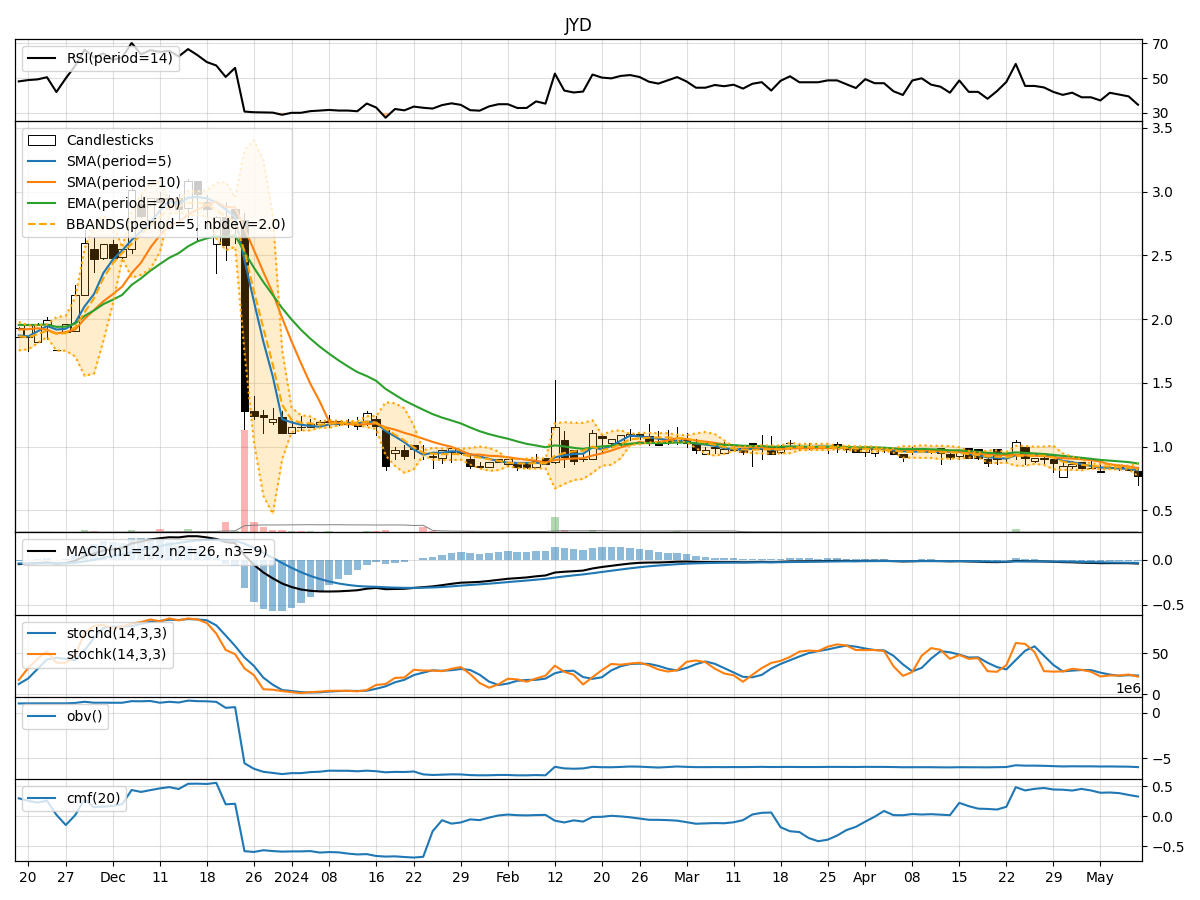
- Moving Averages (MA): The 5-day Moving Average (MA) has been consistently declining, indicating a bearish trend in the short term.
- MACD: The Moving Average Convergence Divergence (MACD) has been negative and decreasing, suggesting a bearish momentum.
- EMA: The Exponential Moving Average (EMA) has also been on a downward trend, reinforcing the bearish sentiment in the stock.
Momentum Analysis:
- RSI: The Relative Strength Index (RSI) has been decreasing and is currently in the oversold territory, indicating a bearish momentum.
- Stochastic Oscillator: Both %K and %D have been trending downwards, further supporting the bearish momentum.
- Williams %R: The Williams %R is in the oversold region, signaling a bearish sentiment in the stock.
Volatility Analysis:
- Bollinger Bands (BB): The Bollinger Bands have been narrowing, suggesting decreasing volatility in the stock.
- BB %B: The %B indicator is near the lower band, indicating a potential oversold condition.
Volume Analysis:
- On-Balance Volume (OBV): The OBV has been declining, reflecting selling pressure in the stock.
- Chaikin Money Flow (CMF): The CMF has also been decreasing, indicating a bearish money flow trend.
Key Observations:
- The stock is currently in a downtrend based on moving averages, MACD, and EMA.
- Momentum indicators such as RSI, Stochastic Oscillator, and Williams %R all point towards a bearish sentiment.
- Volatility has been decreasing, potentially signaling a period of consolidation or sideways movement.
- Volume indicators like OBV and CMF suggest selling pressure and a bearish money flow trend.
Conclusion:
Based on the analysis of the technical indicators, the next few days for JYD stock are likely to see further downward movement. The bearish trend indicated by moving averages, MACD, and momentum indicators is expected to persist. Volatility may remain low, possibly leading to consolidation, while volume indicators point towards continued selling pressure. Therefore, the outlook for JYD stock in the coming days is bearish. Investors should exercise caution and consider risk management strategies in their trading decisions.