Technical Analysis of JXJT 2024-05-10
Overview:
In analyzing the technical indicators for JXJT over the last 5 days, we will delve into the trend, momentum, volatility, and volume indicators to provide a comprehensive outlook on the possible stock price movement. By examining these key factors, we aim to offer valuable insights and predictions for the upcoming days.
Trend Analysis:
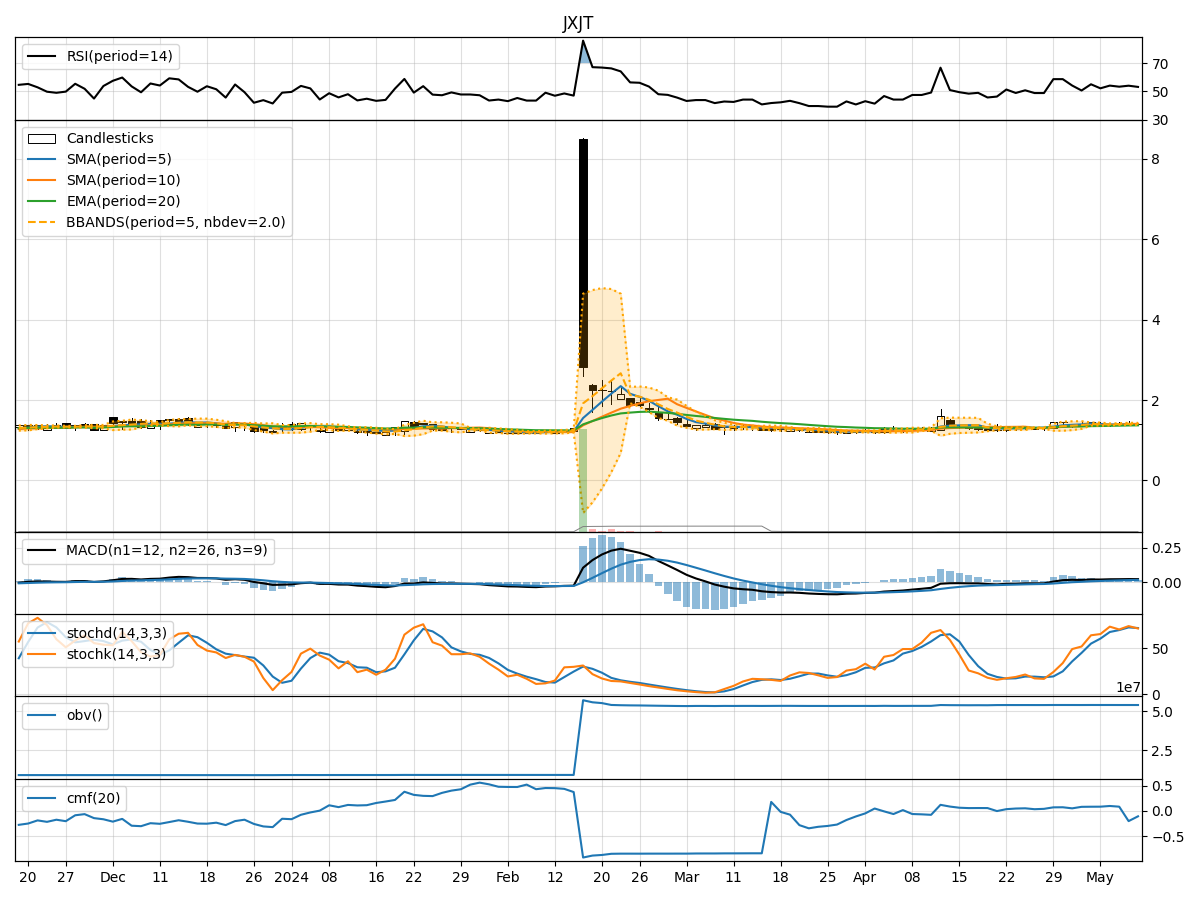
- Moving Averages (MA): The 5-day Moving Average (MA) has been relatively stable around 1.40, indicating a neutral trend in the short term.
- MACD: The MACD line has shown a slight increase over the past 5 days, suggesting a potential bullish momentum.
- EMA: The Exponential Moving Average (EMA) has been gradually rising, reflecting a positive trend in the stock price.
Key Observation: The trend indicators suggest a mildly bullish sentiment in the stock price.
Momentum Analysis:
- RSI: The Relative Strength Index (RSI) has been hovering around the mid-level, indicating a balanced momentum in the stock.
- Stochastic Oscillator: Both %K and %D values have been fluctuating within a range, signaling a lack of strong momentum.
- Williams %R: The Williams %R indicator has been oscillating near the oversold territory, suggesting a potential reversal in momentum.
Key Observation: Momentum indicators point towards a neutral to slightly bearish sentiment in the stock momentum.
Volatility Analysis:
- Bollinger Bands: The Bollinger Bands have shown narrowing volatility, with the stock price trading within the bands consistently.
- Bollinger %B: The %B value has been relatively stable around 0.5, indicating a balanced volatility level.
Key Observation: Volatility indicators suggest a period of consolidation and stability in the stock price.
Volume Analysis:
- On-Balance Volume (OBV): The OBV has been fluctuating without a clear trend, reflecting mixed buying and selling pressure.
- Chaikin Money Flow (CMF): The CMF has shown a slight negative trend over the past few days, indicating a potential outflow of money from the stock.
Key Observation: Volume indicators suggest a lack of strong buying or selling pressure, leading to a neutral volume outlook.
Conclusion:
Based on the analysis of trend, momentum, volatility, and volume indicators, the next few days for JXJT stock price are likely to see sideways movement with a slightly bullish bias. The trend indicators hint at a positive sentiment, while momentum and volume indicators suggest a more neutral outlook. Volatility is expected to remain stable, indicating a period of consolidation.
Recommendation: Considering the overall analysis, it is advisable to closely monitor the stock price for any breakout or reversal signals, especially if the price approaches key support or resistance levels. Investors may consider maintaining a balanced position or adopting a wait-and-see approach until clearer signals emerge in the market dynamics.