Technical Analysis of JFU 2024-05-10
Overview:
In analyzing the technical indicators for JFU over the last 5 days, we will delve into the trend, momentum, volatility, and volume indicators to provide a comprehensive assessment of the stock's potential price movement. By examining these key factors, we aim to offer insights into the possible future direction of JFU's stock price.
Trend Analysis:
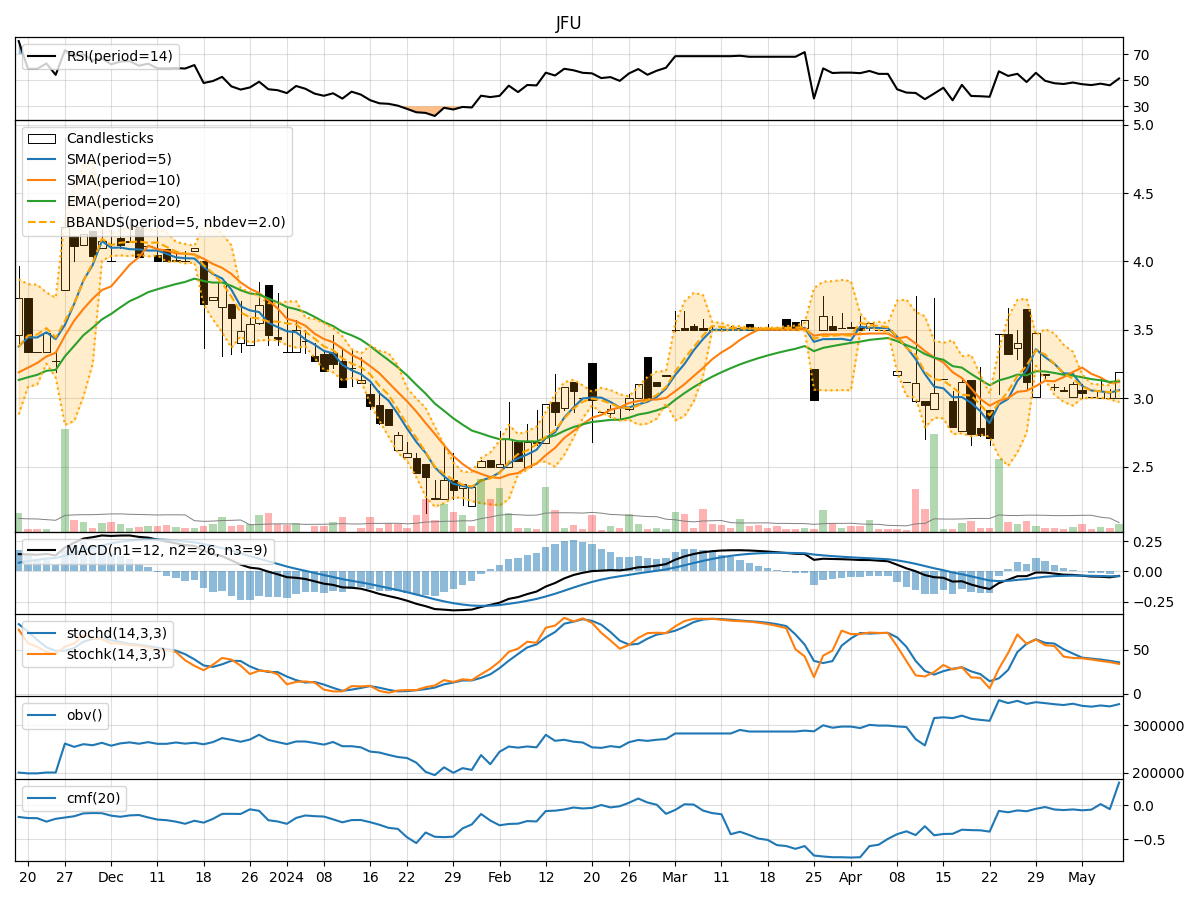
- Moving Averages (MA): The 5-day Moving Average (MA) has been fluctuating around the actual closing prices, indicating a lack of clear trend direction.
- MACD: The Moving Average Convergence Divergence (MACD) has been consistently negative, suggesting a bearish momentum in the short term.
- EMA: The Exponential Moving Average (EMA) has been declining, further supporting the bearish sentiment in the stock.
Momentum Analysis:
- RSI: The Relative Strength Index (RSI) has been hovering around the neutral zone, indicating a lack of strong momentum either bullish or bearish.
- Stochastic Oscillator: Both %K and %D of the Stochastic Oscillator have been decreasing, signaling a potential bearish momentum.
- Williams %R: The Williams %R is in the oversold territory, suggesting a possible reversal or consolidation phase.
Volatility Analysis:
- Bollinger Bands (BB): The Bollinger Bands have been widening, indicating increased volatility in the stock price.
- BB% (Bollinger Band %B): The %B has been fluctuating, reflecting the price's deviation from the moving average.
Volume Analysis:
- On-Balance Volume (OBV): The OBV has shown mixed signals, with no clear trend in volume accumulation or distribution.
- Chaikin Money Flow (CMF): The CMF has been negative, indicating potential selling pressure in the stock.
Key Observations:
- The trend indicators suggest a bearish sentiment with declining moving averages and negative MACD.
- Momentum indicators show a lack of strong momentum, with stochastic indicators pointing towards a bearish bias.
- Volatility has increased, as indicated by the widening Bollinger Bands.
- Volume indicators are inconclusive, with mixed signals from OBV and negative CMF.
Conclusion:
Based on the analysis of the technical indicators, the overall outlook for JFU in the next few days is bearish. The trend indicators, momentum signals, and volatility patterns all point towards a potential downward movement in the stock price. Traders and investors should exercise caution and consider short-term bearish strategies or wait for a clearer trend reversal signal before considering long positions.