Technical Analysis of IXAQ 2024-05-10
Overview:
In analyzing the technical indicators for IXAQ over the last 5 days, we will delve into the trend, momentum, volatility, and volume indicators to provide a comprehensive outlook on the possible stock price movement in the coming days. By examining these key indicators, we aim to offer valuable insights and predictions for potential investors.
Trend Indicators:
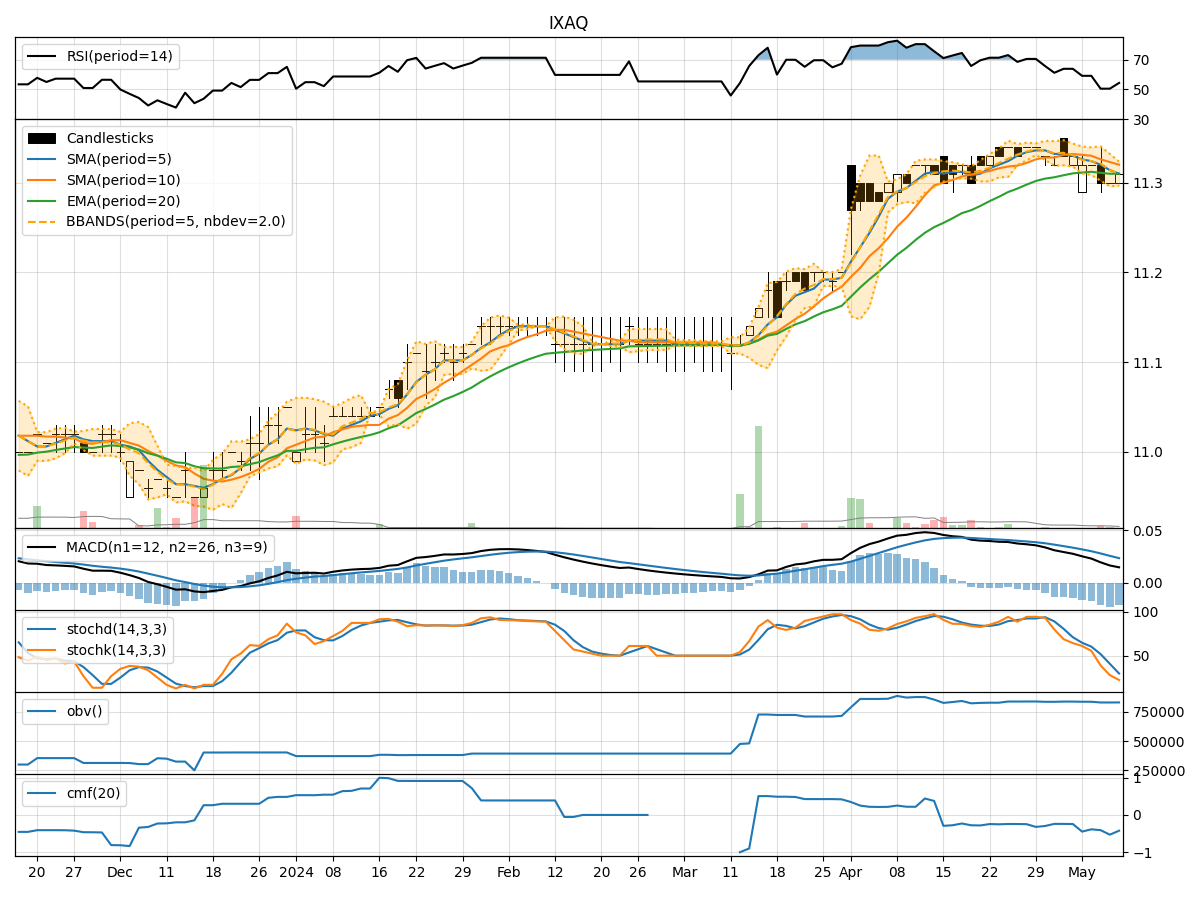
- Moving Averages (MA): The 5-day MA has been relatively stable around the current stock price, indicating a neutral trend.
- MACD: The MACD line has been decreasing, suggesting a potential bearish momentum.
- MACD Histogram: The histogram has been negative, indicating a bearish trend.
Key Observation: The trend indicators are showing a slight bearish sentiment in the short term.
Momentum Indicators:
- RSI: The RSI has been fluctuating around the neutral zone, indicating indecision in the market.
- Stochastic Oscillator: Both %K and %D have been declining, signaling a bearish momentum.
- Williams %R: The indicator is in the oversold territory, suggesting a potential reversal.
Key Observation: Momentum indicators are leaning towards a bearish outlook.
Volatility Indicators:
- Bollinger Bands: The bands have been narrowing, indicating decreasing volatility.
- Bollinger %B: The %B is fluctuating within a tight range, suggesting consolidation.
- Average True Range (ATR): ATR has been decreasing, indicating lower volatility levels.
Key Observation: Volatility indicators point towards a period of consolidation and reduced price fluctuations.
Volume Indicators:
- On-Balance Volume (OBV): The OBV has been relatively flat, indicating a balance between buying and selling pressure.
- Chaikin Money Flow (CMF): The CMF has been negative, suggesting outflow of money from the stock.
Key Observation: Volume indicators reflect a lack of significant buying or selling pressure in the market.
Conclusion:
Based on the analysis of trend, momentum, volatility, and volume indicators, the overall outlook for IXAQ in the next few days is bearish. The trend indicators show a potential bearish momentum, supported by the declining MACD and stochastic oscillator. Momentum indicators also align with this bearish sentiment, with RSI hovering in the neutral zone and Williams %R indicating oversold conditions. Volatility indicators suggest a period of consolidation with reduced price fluctuations, while volume indicators reflect a lack of significant buying interest.
In conclusion, the next few days are likely to see a downward movement in IXAQ's stock price. Investors should exercise caution and consider potential short-term bearish trends in their decision-making process.