Technical Analysis of IVCB 2024-05-10
Overview:
In analyzing the technical indicators for IVCB stock over the last 5 days, we will delve into the trends, momentum, volatility, and volume indicators to provide a comprehensive outlook on the possible future stock price movement. By examining these key indicators, we aim to offer valuable insights and predictions for the upcoming trading days.
Trend Indicators:
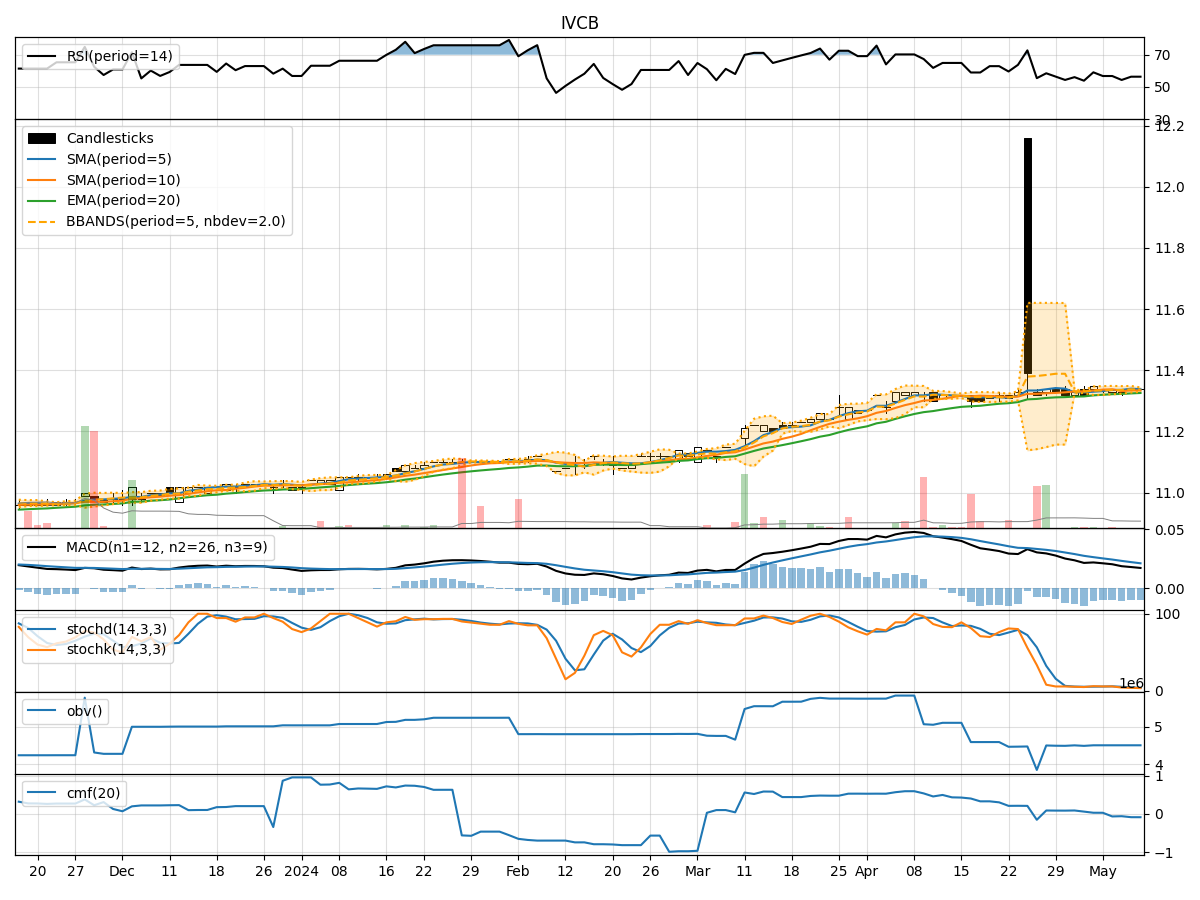
- Moving Averages (MA): The 5-day moving average has been relatively stable around the current stock price, indicating a lack of significant directional movement.
- MACD: The MACD line has been consistently positive, suggesting a bullish momentum in the short term.
- EMA: The exponential moving average has been slightly increasing, reflecting a gradual uptrend in the stock price.
Momentum Indicators:
- RSI: The Relative Strength Index has been hovering around the neutral zone, indicating a balanced momentum between buying and selling pressure.
- Stochastic Oscillator: Both %K and %D have been in oversold territory, signaling a potential reversal or consolidation phase.
- Williams %R: The indicator has been deeply in oversold territory, suggesting a possible buying opportunity in the near future.
Volatility Indicators:
- Bollinger Bands: The bands have been narrowing, indicating decreasing volatility and a potential period of consolidation.
- Bollinger %B: The %B indicator has been fluctuating around the midline, reflecting a lack of clear trend direction.
Volume Indicators:
- On-Balance Volume (OBV): The OBV has been relatively flat, suggesting a balance between buying and selling pressure.
- Chaikin Money Flow (CMF): The CMF has been negative, indicating a net outflow of money from the stock.
Key Observations and Opinions:
- Trend: The stock is currently in a sideways trend with a slight bullish bias based on the MACD and EMA indicators.
- Momentum: The momentum indicators suggest a potential reversal or consolidation phase in the near term.
- Volatility: Decreasing volatility and narrowing Bollinger Bands indicate a period of consolidation.
- Volume: The volume indicators show a lack of significant buying or selling pressure.
Conclusion:
Based on the analysis of the technical indicators, the next few days for IVCB stock are likely to see sideways movement with a slight bullish bias. Traders may expect the stock price to consolidate within a narrow range, with potential for a minor uptick based on the MACD and EMA signals. However, caution is advised due to the mixed signals from momentum and volume indicators. It is recommended to closely monitor key support and resistance levels for potential trading opportunities.