Technical Analysis of IVA 2024-05-10
Overview:
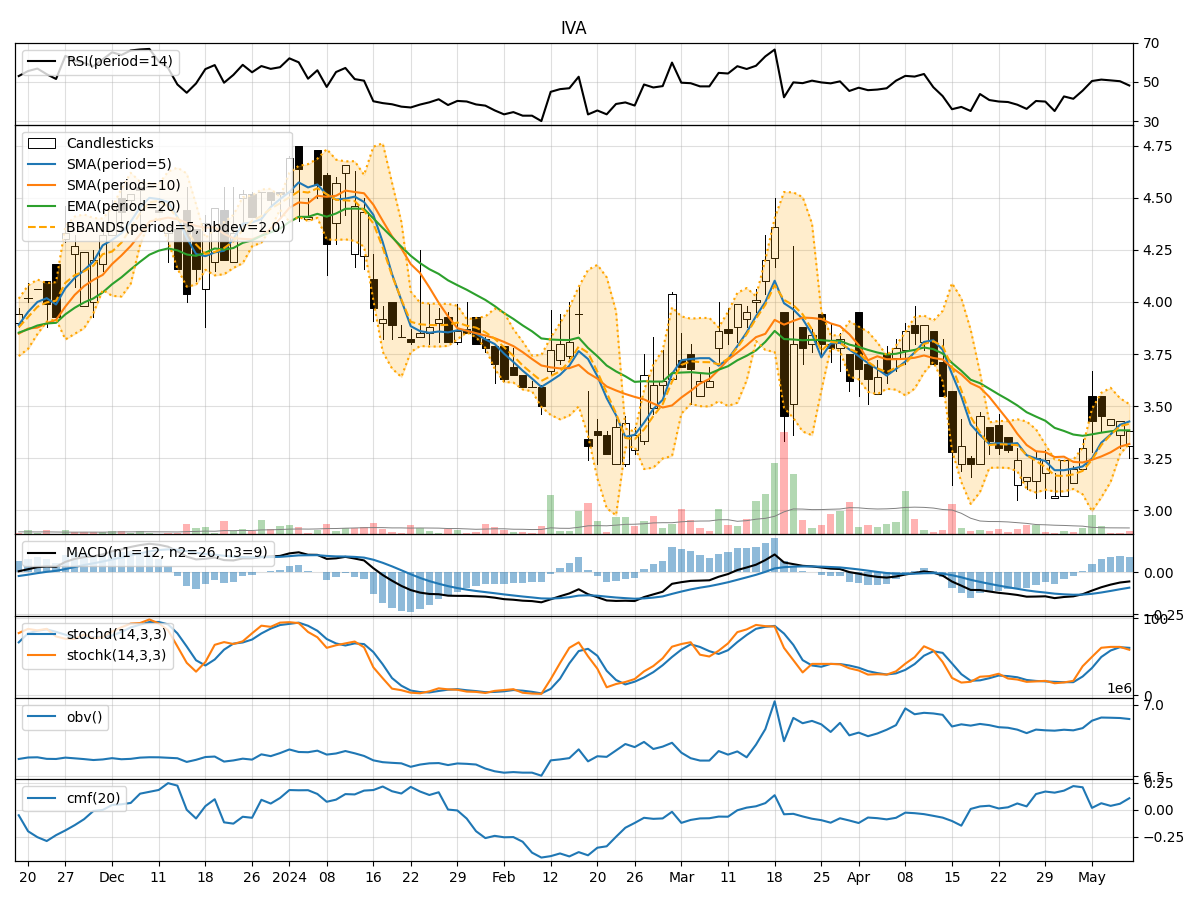
In analyzing the technical indicators for IVA stock over the last 5 days, we will delve into the trend, momentum, volatility, and volume indicators to provide a comprehensive outlook on the possible stock price movement in the coming days.
Trend Analysis:
- Moving Averages (MA): The 5-day Moving Average (MA) has been consistently above the Simple Moving Average (SMA) and Exponential Moving Average (EMA) over the past 5 days, indicating a short-term uptrend.
- MACD: The Moving Average Convergence Divergence (MACD) has been negative but showing signs of convergence towards the signal line, suggesting a potential reversal in the trend.
Momentum Analysis:
- RSI: The Relative Strength Index (RSI) has been hovering around the neutral zone, indicating a lack of strong momentum in either direction.
- Stochastic Oscillator: The Stochastic Oscillator is in the overbought territory, suggesting a possible near-term reversal or consolidation.
Volatility Analysis:
- Bollinger Bands (BB): The Bollinger Bands have been narrowing, indicating decreasing volatility and a potential breakout or breakdown in the near future.
Volume Analysis:
- On-Balance Volume (OBV): The OBV has been relatively stable, showing a slight increase in volume over the past few days.
- Chaikin Money Flow (CMF): The CMF is positive, indicating buying pressure in the market.
Key Observations:
- The trend indicators suggest a short-term uptrend, albeit with some signs of potential reversal.
- Momentum indicators show a lack of strong momentum in either direction, indicating a possible period of consolidation.
- Volatility indicators point towards decreasing volatility, signaling a potential price breakout or breakdown.
- Volume indicators reflect a slight increase in buying pressure but not strong enough to indicate a significant price movement.
Conclusion:
Based on the analysis of the technical indicators, the stock price of IVA is likely to experience a period of consolidation in the coming days. The lack of strong momentum, narrowing Bollinger Bands, and stable volume suggest a potential sideways movement or a minor correction in the price. Traders should exercise caution and wait for a clearer trend to emerge before making significant trading decisions.