Technical Analysis of ITRM 2024-05-10
Overview:
In analyzing the technical indicators for ITRM over the last 5 days, we will delve into the trend, momentum, volatility, and volume indicators to provide a comprehensive outlook on the possible stock price movement. By examining these key aspects, we aim to offer valuable insights and predictions for the upcoming days.
Trend Analysis:
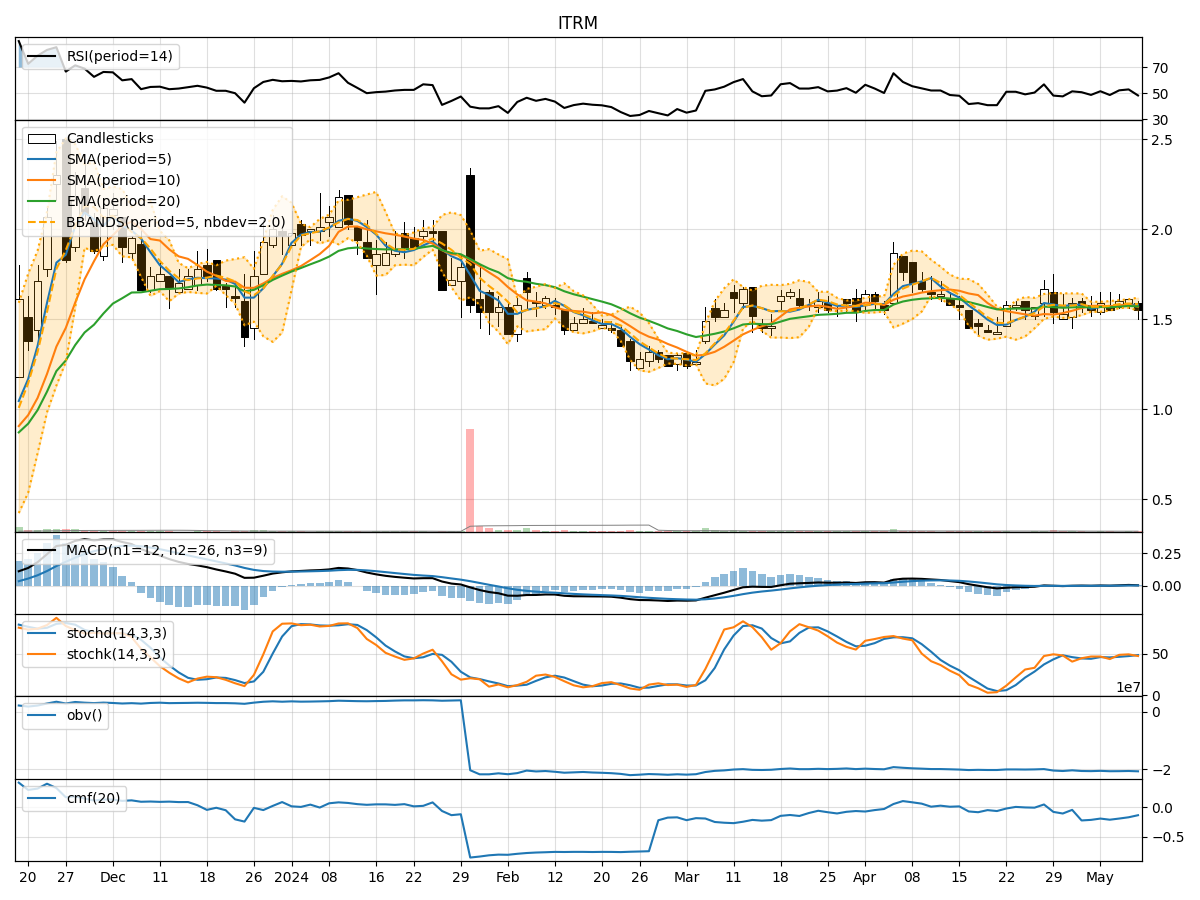
- Moving Averages (MA): The 5-day Moving Average (MA) has been fluctuating around the closing prices, indicating a lack of clear trend direction.
- MACD: The MACD line has shown positive values, suggesting a bullish momentum in the short term.
- EMA: The Exponential Moving Average (EMA) has been slightly increasing, reflecting a potential bullish sentiment.
Momentum Analysis:
- RSI: The Relative Strength Index (RSI) has been hovering around the neutral zone, indicating a balanced momentum.
- Stochastic Oscillator: Both %K and %D values have been fluctuating, signaling indecision in momentum.
- Williams %R: The Williams %R is in oversold territory, suggesting a possible reversal in momentum.
Volatility Analysis:
- Bollinger Bands (BB): The Bollinger Bands have shown narrowing bands, indicating decreasing volatility.
- BB%: The %B indicator has been fluctuating, reflecting uncertainty in volatility levels.
Volume Analysis:
- On-Balance Volume (OBV): The OBV has shown mixed movements, indicating a lack of clear accumulation or distribution.
- Chaikin Money Flow (CMF): The CMF has been negative, suggesting a bearish sentiment in terms of volume flow.
Conclusion:
Based on the analysis of the technical indicators, the stock of ITRM is currently exhibiting mixed signals across different categories. The trend indicators suggest a potential bullish sentiment in the short term, supported by the positive MACD and EMA values. However, the momentum indicators show indecision and a slight bearish bias, especially with the Williams %R in oversold territory.
The volatility indicators point towards decreasing volatility, which could lead to a period of consolidation or sideways movement. The volume indicators also reflect a lack of clear direction, with mixed movements in OBV and a bearish sentiment in CMF.
Overall Assessment:
Considering the mixed signals from the technical indicators, it is prudent to exercise caution in predicting the next few days' stock price movement for ITRM. The stock may experience a period of consolidation or sideways trading, with a potential for a slight bullish bias in the short term. Traders and investors should closely monitor key levels and wait for clearer signals before making significant trading decisions.