Technical Analysis of IRAA 2024-05-10
Overview:
In analyzing the technical indicators for IRAA stock over the last 5 days, we will delve into the trend, momentum, volatility, and volume indicators to provide a comprehensive outlook on the possible stock price movement in the coming days. By examining these key indicators, we aim to offer valuable insights and predictions to guide investment decisions.
Trend Analysis:
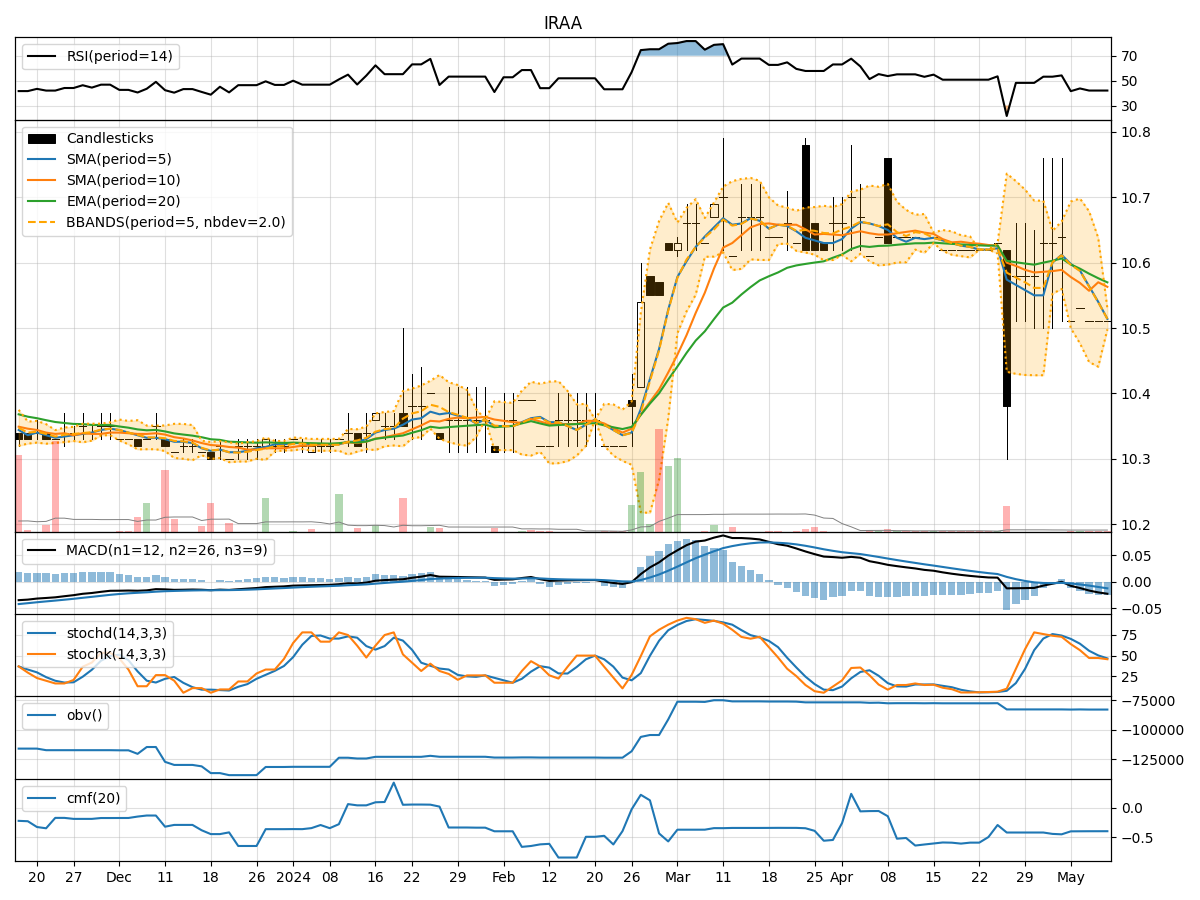
- Moving Averages (MA): The 5-day Moving Average (MA) has been consistently below the Simple Moving Average (SMA) and Exponential Moving Average (EMA) over the past 5 days, indicating a downward trend in the stock price.
- MACD: The Moving Average Convergence Divergence (MACD) has been negative and decreasing, suggesting a bearish momentum in the stock.
- Conclusion: The trend indicators point towards a downward movement in the stock price.
Momentum Analysis:
- RSI: The Relative Strength Index (RSI) has been hovering around 40-45, indicating a neutral momentum in the stock.
- Stochastic Oscillator: Both %K and %D of the Stochastic Oscillator are below 50, reflecting a bearish momentum.
- Conclusion: The momentum indicators suggest a bearish sentiment in the stock.
Volatility Analysis:
- Bollinger Bands (BB): The Bollinger Bands have been narrowing, indicating decreasing volatility in the stock price.
- Conclusion: The volatility indicators signal a low volatility environment for the stock.
Volume Analysis:
- On-Balance Volume (OBV): The OBV has remained relatively flat over the past 5 days, suggesting a lack of significant buying or selling pressure.
- Chaikin Money Flow (CMF): The CMF has been negative, indicating a bearish money flow in the stock.
- Conclusion: The volume indicators imply a neutral to bearish outlook for the stock.
Overall Conclusion:
Based on the analysis of trend, momentum, volatility, and volume indicators, the overall outlook for IRAA stock in the next few days is bearish. The trend is downward, momentum is bearish, volatility is low, and volume is neutral to bearish. Therefore, it is likely that the stock price will experience a further decline in the upcoming trading sessions.
Recommendation:
Considering the bearish signals from multiple technical indicators, investors may consider caution in their approach towards IRAA stock. It is advisable to closely monitor the price action and wait for potential signs of a trend reversal before considering any buying opportunities. Risk management strategies should be implemented to mitigate potential losses in a declining market environment.
Disclaimer:
Please note that technical analysis is not a guaranteed predictor of future price movements, and market dynamics can change rapidly. It is essential to conduct thorough research and consider other fundamental factors before making investment decisions. Consulting with a financial advisor is recommended to tailor strategies to individual investment goals and risk tolerance levels.