Technical Analysis of IPHA 2024-05-10
Overview:
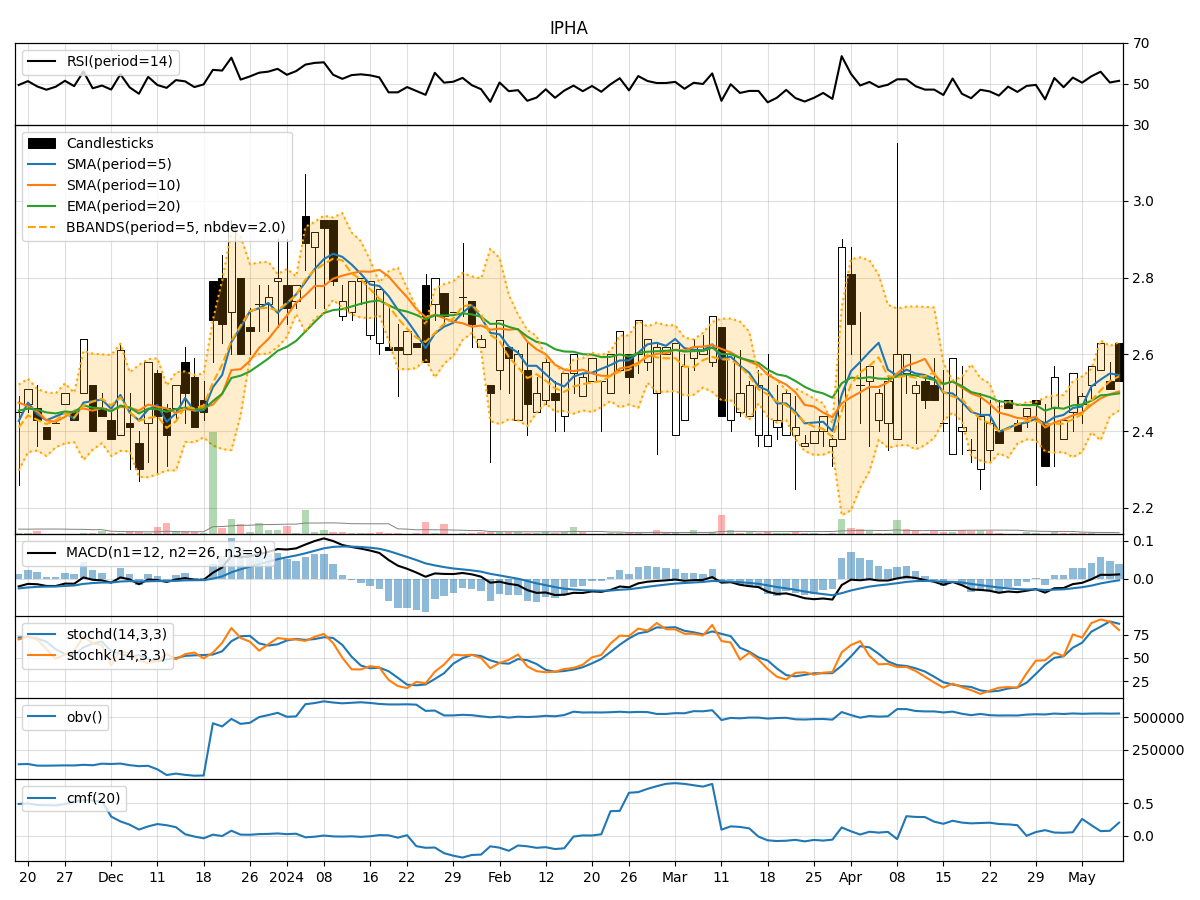
In analyzing the technical indicators for IPHA over the last 5 days, we will delve into the trend, momentum, volatility, and volume indicators to provide a comprehensive outlook on the possible stock price movement. By examining these key aspects, we aim to offer valuable insights and predictions for the upcoming days.
Trend Analysis:
- Moving Averages (MA): The 5-day Moving Average (MA) has been showing an upward trend, indicating a positive momentum in the stock price.
- MACD: The Moving Average Convergence Divergence (MACD) has been consistently positive, suggesting a bullish trend in the stock.
- EMA: The Exponential Moving Average (EMA) has been trending upwards, further supporting the bullish sentiment in the stock.
Momentum Analysis:
- RSI: The Relative Strength Index (RSI) has been fluctuating around the neutral zone, indicating a balanced momentum in the stock.
- Stochastic Oscillator: The Stochastic Oscillator has shown some overbought conditions but has not reached extreme levels, suggesting a potential for further upside.
- Williams %R: The Williams %R indicator has been hovering in the oversold territory, indicating a possible reversal in the stock price.
Volatility Analysis:
- Bollinger Bands: The Bollinger Bands have shown a slight expansion, indicating increased volatility in the stock price.
- Bollinger %B: The Bollinger %B has been fluctuating within a moderate range, suggesting a balanced volatility outlook for the stock.
Volume Analysis:
- On-Balance Volume (OBV): The OBV indicator has shown a slight increase, indicating a positive volume flow into the stock.
- Chaikin Money Flow (CMF): The CMF has been positive, reflecting a bullish sentiment in terms of volume flow.
Key Observations and Opinions:
- Trend: The trend indicators suggest a bullish sentiment in the stock, supported by positive moving averages and MACD.
- Momentum: The momentum indicators show a mixed outlook, with RSI indicating neutrality, Stochastic Oscillator hinting at potential upside, and Williams %R signaling a reversal.
- Volatility: The volatility indicators point towards a moderate increase in volatility, which could lead to some price fluctuations.
- Volume: The volume indicators indicate a positive volume flow into the stock, supporting the bullish sentiment.
Conclusion:
Based on the analysis of the technical indicators, the overall outlook for IPHA in the next few days is bullish. The trend indicators, supported by positive momentum and volume flow, suggest a potential upward movement in the stock price. Traders and investors may consider taking long positions or holding onto existing positions to capitalize on the expected bullish trend. However, it is essential to monitor the indicators closely for any signs of reversal or increased volatility.