Technical Analysis of IOSP 2024-05-31
Overview:
In analyzing the technical indicators for IOSP over the last 5 days, we will delve into the trend, momentum, volatility, and volume indicators to provide a comprehensive outlook on the possible stock price movement in the coming days.
Trend Analysis:
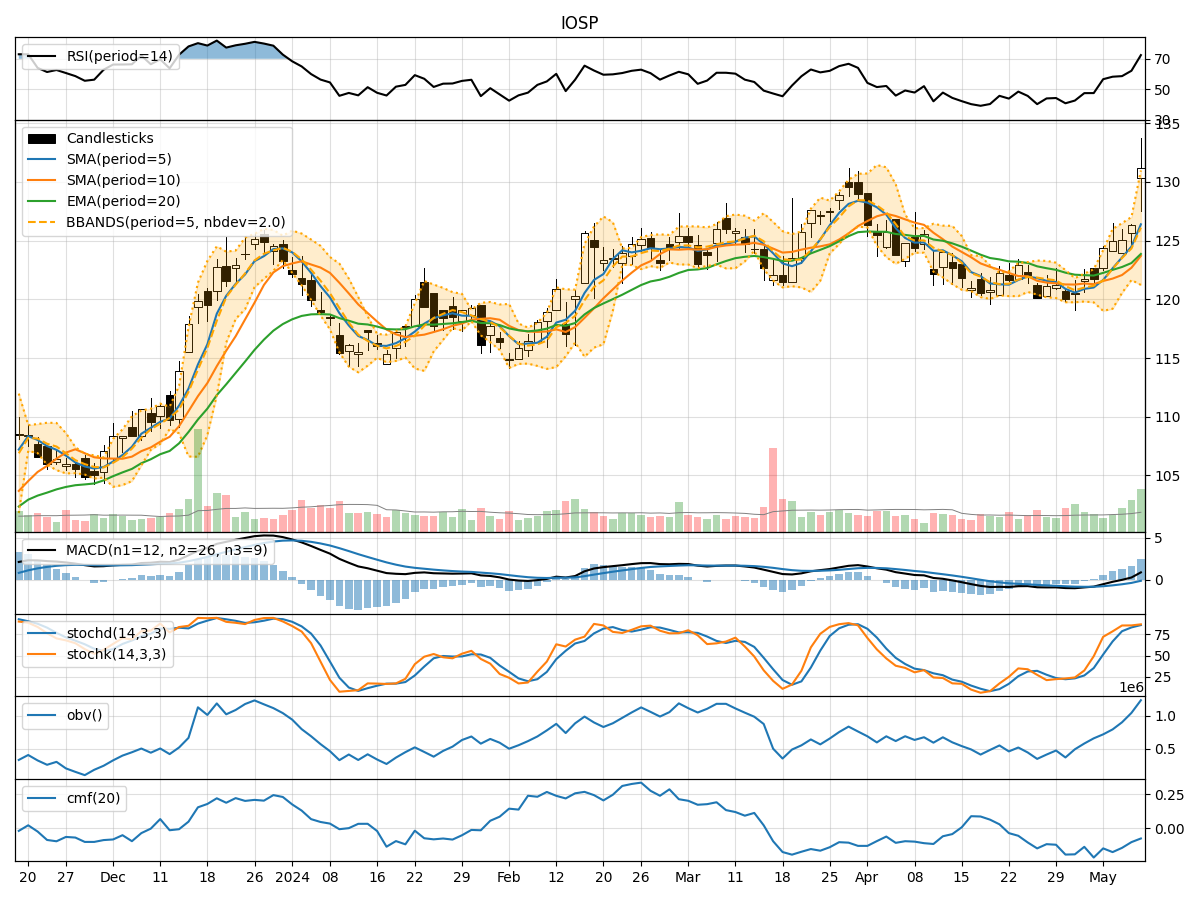
- Moving Averages (MA): The 5-day MA has been fluctuating around the closing prices, indicating short-term price trends. The SMA(10) and EMA(20) have shown a slight downward trend, suggesting a potential bearish sentiment.
- MACD: The MACD line has been decreasing, with the MACD histogram also showing a decline. This indicates a weakening bullish momentum in the stock.
Momentum Analysis:
- RSI: The RSI has been fluctuating around the 50 level, indicating a lack of strong momentum in either direction.
- Stochastic Oscillator: Both %K and %D have been trending downwards, suggesting a bearish momentum in the stock.
- Williams %R: The Williams %R is in oversold territory, indicating a potential reversal in the stock price.
Volatility Analysis:
- Bollinger Bands: The stock price has been trading within the Bollinger Bands, with the bands narrowing. This suggests a period of consolidation and potential reduced volatility.
- Bollinger %B: The %B indicator is hovering around the middle range, indicating a balanced market sentiment.
Volume Analysis:
- On-Balance Volume (OBV): The OBV has shown mixed signals, with fluctuations in volume accumulation. This indicates indecision among investors.
- Chaikin Money Flow (CMF): The CMF has been increasing, suggesting a potential inflow of money into the stock.
Key Observations:
- The trend indicators point towards a bearish sentiment, with moving averages and MACD showing a downward trend.
- Momentum indicators suggest a lack of strong momentum, with stochastic oscillators indicating a bearish bias.
- Volatility indicators signal a period of consolidation and reduced volatility.
- Volume indicators show mixed signals, with OBV fluctuating and CMF indicating a potential inflow of money.
Conclusion:
Based on the analysis of the technical indicators, the stock price of IOSP is likely to experience further downward movement in the coming days. The bearish trend indicated by moving averages and MACD, coupled with the bearish momentum suggested by stochastic oscillators, supports a bearish view on the stock. Additionally, the period of consolidation and reduced volatility indicated by Bollinger Bands further strengthens the downward bias. Investors should exercise caution and consider potential shorting opportunities in the stock.