Technical Analysis of INVZ 2024-05-10
Overview:
In analyzing the technical indicators for INVZ over the last 5 days, we will delve into the trend, momentum, volatility, and volume indicators to provide a comprehensive outlook on the possible stock price movement in the coming days. By examining these key aspects, we aim to offer valuable insights and predictions to guide investment decisions.
Trend Analysis:
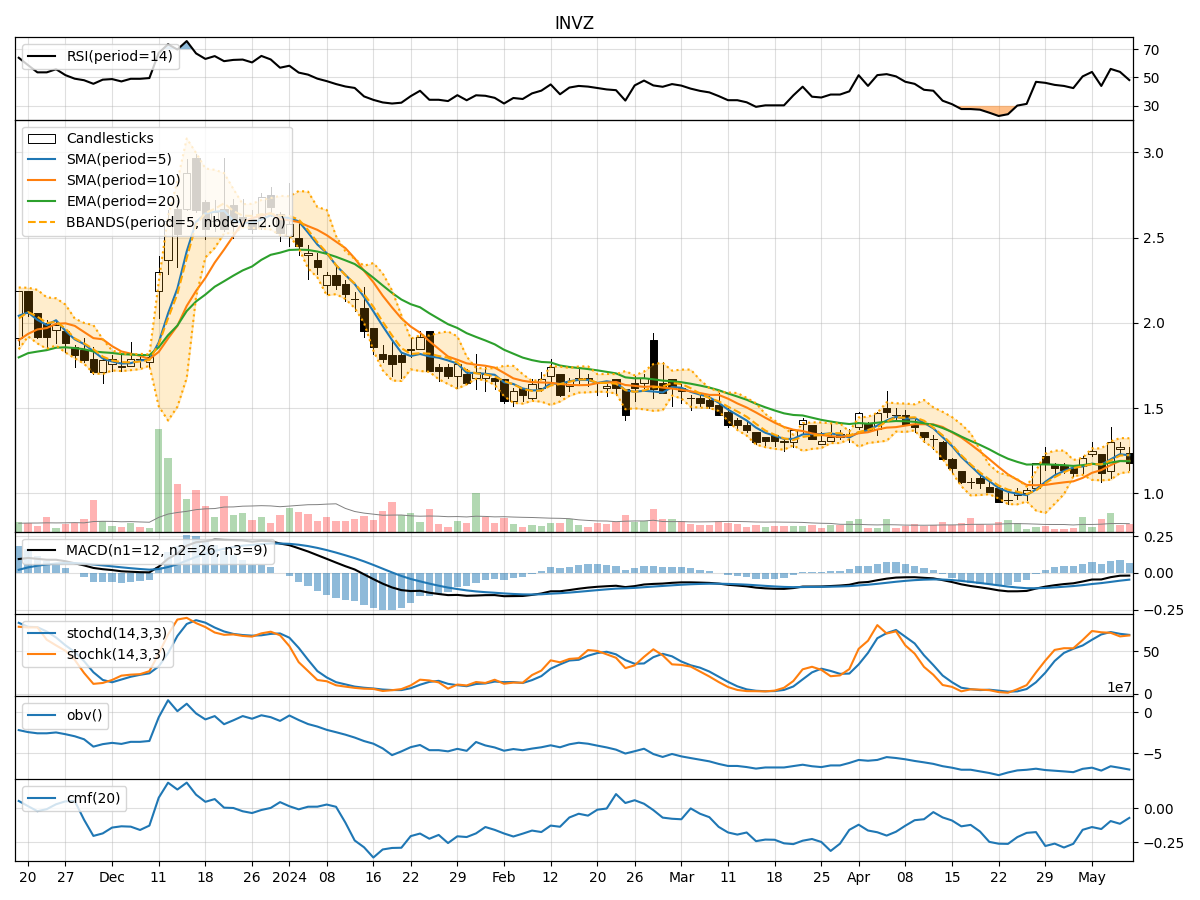
- Moving Averages (MA): The 5-day MA has been fluctuating around the closing prices, indicating short-term price trends. The SMA(10) and EMA(20) show a gradual increase, suggesting a potential bullish trend.
- MACD: The MACD line has been negative but moving closer to the signal line, indicating a possible trend reversal towards the upside.
- MACD Histogram: The histogram has been showing positive values, signaling increasing bullish momentum.
Momentum Analysis:
- RSI: The RSI has been fluctuating around the 50 level, indicating a neutral momentum in the stock.
- Stochastic Oscillator: Both %K and %D have been hovering around the mid-range, suggesting a lack of strong momentum in either direction.
- Williams %R: The indicator has been in oversold territory, indicating a potential reversal to the upside.
Volatility Analysis:
- Bollinger Bands: The bands have been narrowing, indicating decreasing volatility in the stock price.
- Bollinger %B: The %B indicator has been fluctuating around the midline, suggesting a balanced market sentiment.
Volume Analysis:
- On-Balance Volume (OBV): The OBV has been declining, indicating selling pressure in the stock.
- Chaikin Money Flow (CMF): The CMF has been negative, reflecting a lack of buying interest in the stock.
Key Observations:
- The trend indicators suggest a potential bullish trend in the short term.
- Momentum indicators show a neutral stance with a slight bias towards a bullish reversal.
- Volatility indicators point towards decreasing volatility in the stock price.
- Volume indicators indicate selling pressure and a lack of significant buying interest.
Conclusion:
Based on the analysis of the technical indicators, the stock price of INVZ is likely to experience sideways consolidation in the coming days. While there are indications of a potential bullish trend in the short term, the overall market sentiment remains neutral with a lack of strong momentum in either direction. Traders should exercise caution and closely monitor key levels for potential breakout opportunities.