Technical Analysis of INM 2024-05-10
Overview:
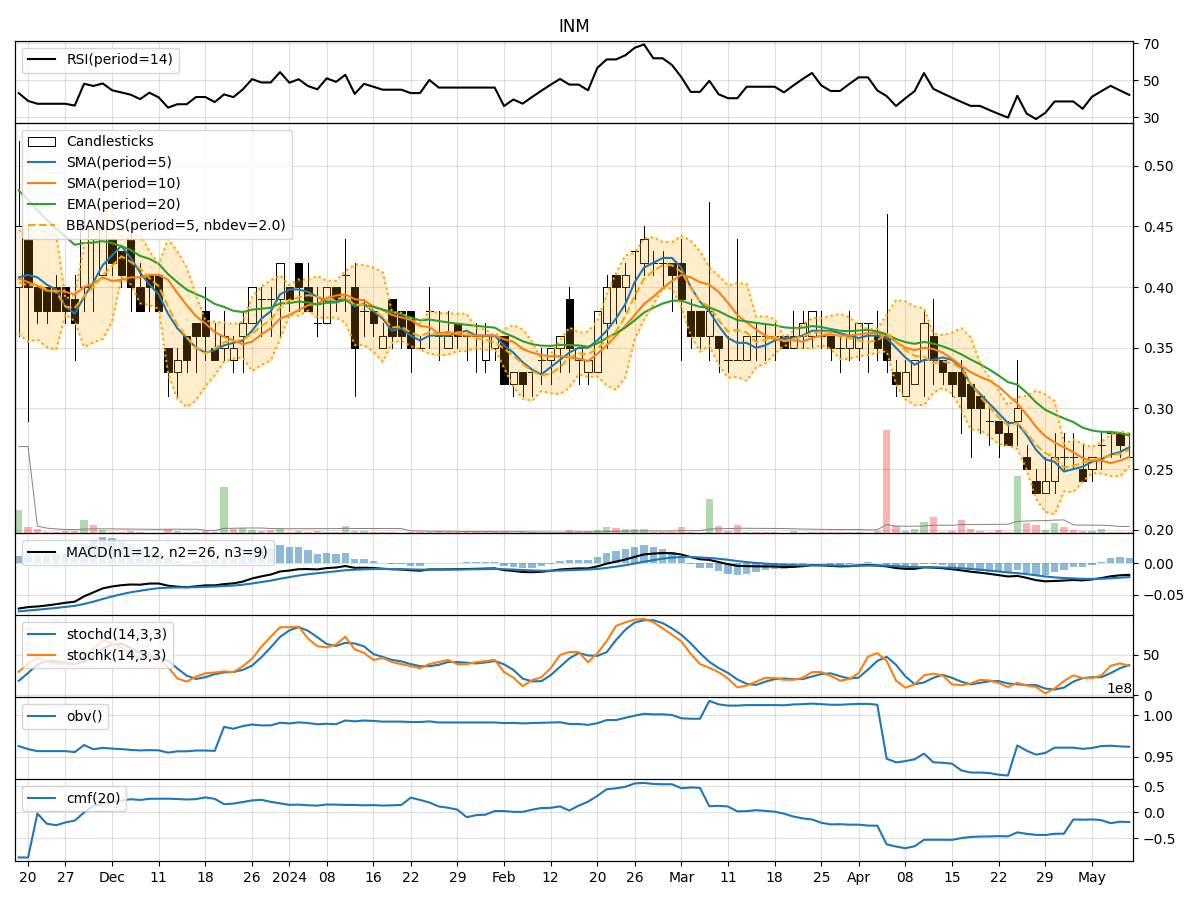
In analyzing the technical indicators for the stock of INM over the last 5 days, we will delve into the trends, momentum, volatility, and volume indicators to provide a comprehensive outlook on the possible stock price movement in the coming days. By examining these key indicators, we aim to offer valuable insights and recommendations for potential investors.
Trend Analysis:
- Moving Averages (MA): The 5-day Moving Average (MA) has been fluctuating around the closing prices, indicating a lack of clear trend direction.
- MACD and Signal Line: The MACD has been consistently negative, suggesting a bearish momentum in the stock price.
- Relative Strength Index (RSI): The RSI values have been hovering around the mid-range, indicating a neutral sentiment in the market.
Momentum Analysis:
- Stochastic Oscillator: The Stochastic Oscillator has shown some fluctuations but remains in the neutral zone, not providing a clear signal.
- Williams %R (WillR): The Williams %R indicator has been consistently in the oversold territory, suggesting a potential reversal in the stock price.
Volatility Analysis:
- Bollinger Bands (BB): The Bollinger Bands have shown narrowing volatility, indicating a potential decrease in price fluctuations.
- Bollinger Band %B (BBP): The %B indicator has been fluctuating within a narrow range, reflecting a period of consolidation.
Volume Analysis:
- On-Balance Volume (OBV): The OBV has shown a slight decrease over the last 5 days, indicating some selling pressure in the stock.
- Chaikin Money Flow (CMF): The CMF has been negative, suggesting a bearish sentiment in the market.
Conclusion:
Based on the analysis of the technical indicators, the stock of INM is currently exhibiting a lack of clear trend direction, with mixed signals from momentum, volatility, and volume indicators. The overall sentiment in the market appears to be neutral to slightly bearish, with signs of consolidation and potential downside risk.
Forecast:
Given the current technical outlook, the next few days for INM stock are likely to see sideways movement with a slight bearish bias. Investors should exercise caution and closely monitor key support and resistance levels for potential entry or exit points. It is advisable to wait for more definitive signals or confirmation of a trend before making significant trading decisions.