Technical Analysis of IMTE 2024-05-10
Overview:
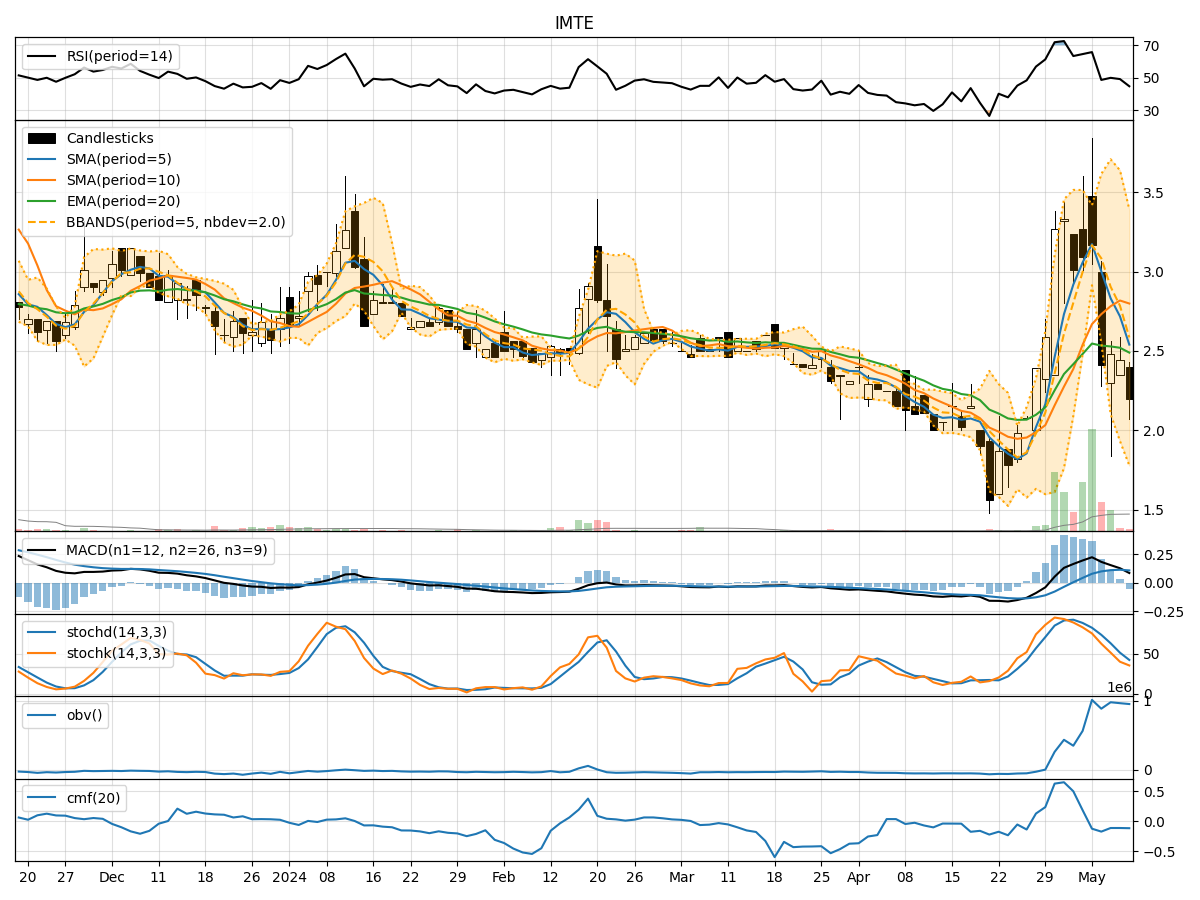
In analyzing the technical indicators for IMTE over the last 5 days, we will delve into the trend, momentum, volatility, and volume indicators to provide a comprehensive outlook on the possible stock price movement. By examining these key aspects, we aim to offer valuable insights and predictions for the upcoming days.
Trend Analysis:
- Moving Averages (MA): The 5-day Moving Average (MA) has been fluctuating, indicating some volatility in the stock price.
- MACD: The MACD line has shown positive values, suggesting a bullish momentum in the short term.
- EMA: The Exponential Moving Average (EMA) has been on an upward trend, indicating a positive outlook.
Key Observation: The trend indicators suggest a potential bullish sentiment in the short term.
Momentum Analysis:
- RSI: The Relative Strength Index (RSI) has been fluctuating around the neutral zone, indicating indecision in the market.
- Stochastic Oscillator: Both %K and %D have been declining, signaling a potential bearish momentum.
- Williams %R: The Williams %R is in the oversold territory, indicating a possible reversal.
Key Observation: The momentum indicators suggest a mixed sentiment with a slight bearish bias.
Volatility Analysis:
- Bollinger Bands: The Bollinger Bands have been narrowing, indicating decreasing volatility.
- Bollinger %B: The %B indicator has been hovering around the middle, suggesting a balanced market sentiment.
Key Observation: Volatility has been decreasing, indicating a potential period of consolidation.
Volume Analysis:
- On-Balance Volume (OBV): The OBV has been relatively stable, indicating a balance between buying and selling pressure.
- Chaikin Money Flow (CMF): The CMF has been negative, suggesting outflows from the stock.
Key Observation: The volume indicators point towards a neutral stance with a slight selling pressure.
Conclusion:
Based on the analysis of the technical indicators, the next few days for IMTE could see sideways movement with a slight bearish bias. The trend indicators suggest a bullish sentiment in the short term, while the momentum indicators indicate a mixed sentiment leaning towards bearishness. Volatility is decreasing, signaling a potential consolidation phase, and volume indicators point towards a neutral stance with slight selling pressure.
Overall, the stock is likely to trade within a range with a downward bias in the near future. Traders should exercise caution and closely monitor key support and resistance levels for potential trading opportunities.