Technical Analysis of IMCC 2024-05-10
Overview:
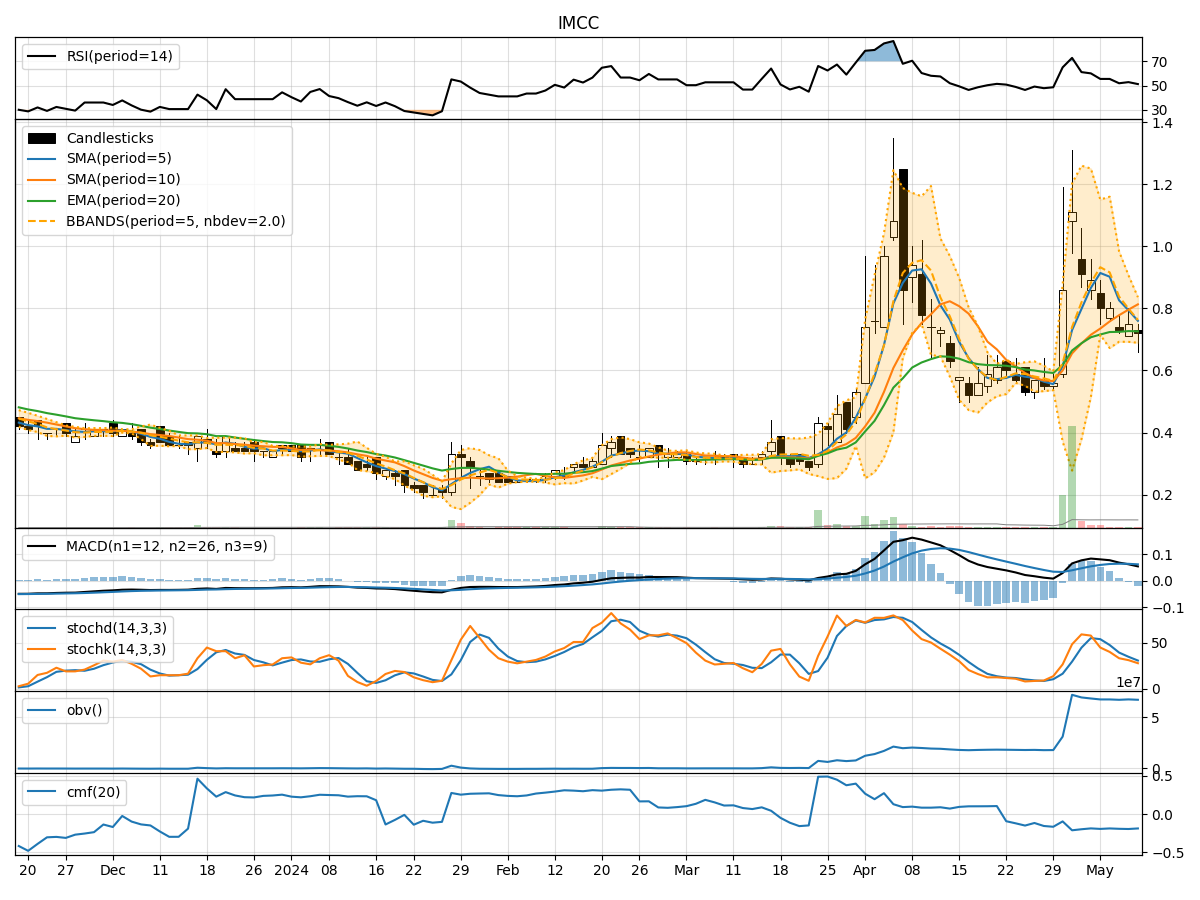
In analyzing the technical indicators for IMCC over the last 5 days, we will delve into the trends, momentum, volatility, and volume indicators to provide a comprehensive outlook on the possible stock price movement in the coming days.
Trend Analysis:
- Moving Averages (MA): The 5-day Moving Average (MA) has been consistently below the closing prices, indicating a downward trend.
- MACD: The MACD line has been decreasing, with the MACD histogram also showing a downward trend, suggesting bearish momentum.
Momentum Analysis:
- RSI: The Relative Strength Index (RSI) has been hovering around the mid-range, indicating a lack of strong momentum in either direction.
- Stochastic Oscillator: Both %K and %D have been declining, signaling weakening momentum.
Volatility Analysis:
- Bollinger Bands (BB): The Bollinger Bands have been narrowing, indicating decreasing volatility in the stock price.
Volume Analysis:
- On-Balance Volume (OBV): The OBV has been relatively stable, showing no significant accumulation or distribution of the stock.
- Chaikin Money Flow (CMF): The CMF has been negative, suggesting selling pressure in the stock.
Key Observations:
- The stock is currently in a downtrend based on moving averages and MACD indicators.
- Momentum is weakening as indicated by RSI and Stochastic Oscillator.
- Volatility is decreasing according to Bollinger Bands.
- Volume indicators show no clear accumulation or distribution pattern.
Conclusion:
Based on the analysis of technical indicators, the next few days' possible stock price movement for IMCC is likely to be sideways to slightly bearish. The stock is expected to continue its current downtrend with limited volatility and momentum. Traders may consider short-term selling opportunities or staying on the sidelines until a clearer trend emerges. It is crucial to monitor key support levels for potential reversals and to wait for stronger bullish signals before considering long positions.