Technical Analysis of IMAB 2024-05-10
Overview:
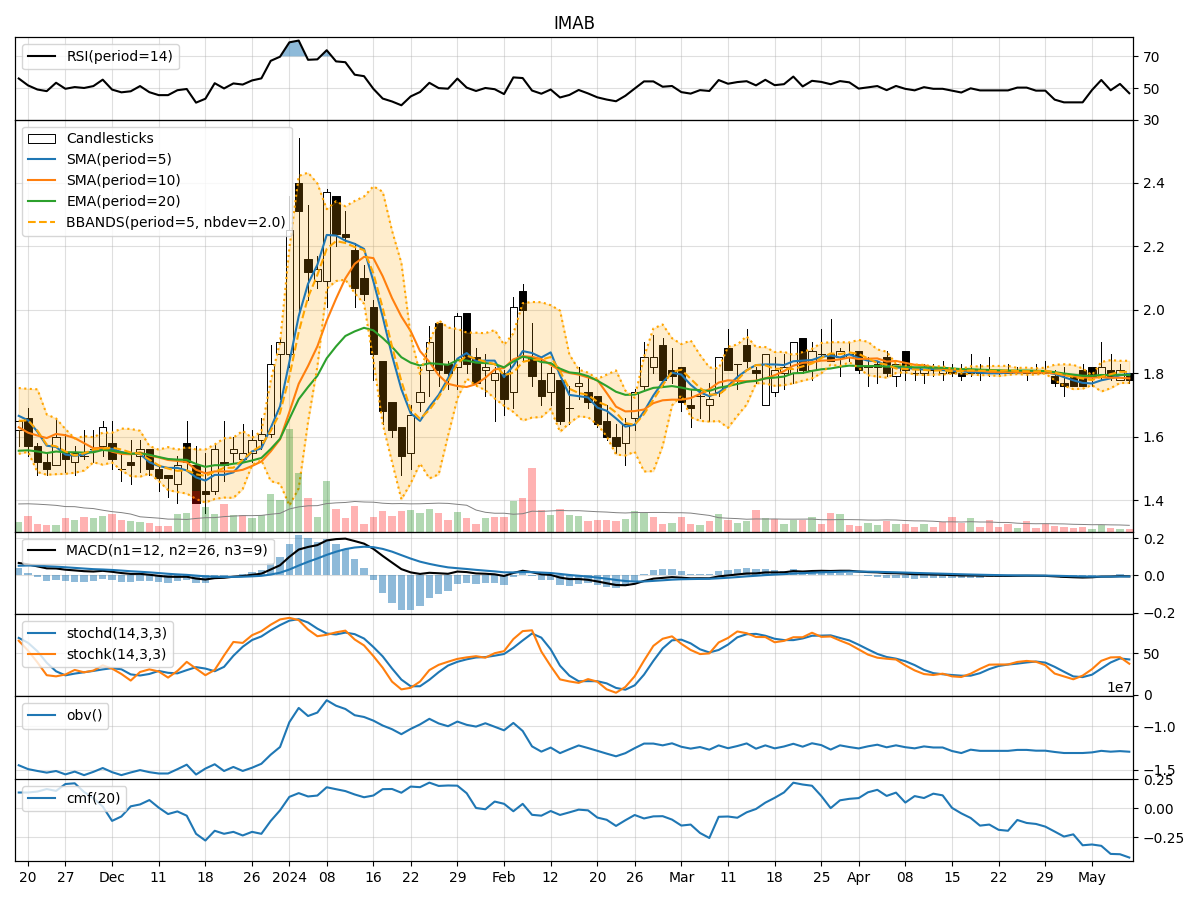
In analyzing the technical indicators for IMAB stock over the last 5 days, we will delve into the trend, momentum, volatility, and volume indicators to provide a comprehensive outlook on the possible stock price movement in the coming days. By examining key metrics such as moving averages, MACD, RSI, Bollinger Bands, and OBV, we aim to offer valuable insights and predictions for potential investors.
Trend Indicators:
- Moving Averages (MA): The 5-day MA has been fluctuating around the closing prices, indicating a lack of clear trend direction.
- MACD: The MACD line has been consistently below the signal line, suggesting a bearish momentum in the short term.
- EMA: The EMA has been relatively stable, reflecting a neutral trend.
Key Observation: The trend indicators show mixed signals with a slight bearish bias.
Momentum Indicators:
- RSI: The RSI has been oscillating around the 50 level, indicating a balanced momentum between buying and selling pressure.
- Stochastic Oscillator: Both %K and %D have been moving within the neutral zone, suggesting a lack of strong momentum.
- Williams %R: The Williams %R is hovering in the oversold territory, signaling a potential buying opportunity.
Key Observation: Momentum indicators suggest a neutral stance with a slight inclination towards a bullish reversal.
Volatility Indicators:
- Bollinger Bands (BB): The bands have been narrowing, indicating decreasing volatility and a potential price breakout.
- BB %B: The %B indicator is currently below 0.2, suggesting the stock is oversold.
Key Observation: Volatility indicators point towards a potential price breakout after a period of consolidation.
Volume Indicators:
- On-Balance Volume (OBV): The OBV has been declining, indicating selling pressure and a bearish sentiment.
- Chaikin Money Flow (CMF): The CMF has been consistently negative, reflecting a lack of buying interest.
Key Observation: Volume indicators highlight a bearish sentiment with decreasing buying pressure.
Conclusion:
Based on the analysis of the technical indicators, the stock price of IMAB is likely to experience further downward movement in the coming days. The trend indicators show a slight bearish bias, while momentum indicators suggest a potential bullish reversal. Volatility indicators point towards a breakout after a period of consolidation, but volume indicators indicate a bearish sentiment with decreasing buying pressure.
Overall, the stock is expected to continue its downward trend in the short term, with a possibility of a bullish reversal based on momentum indicators. Traders should exercise caution and consider waiting for a clear confirmation of a trend reversal before considering any long positions.