Technical Analysis of ILAG 2024-05-10
Overview:
In analyzing the technical indicators for ILAG stock over the last 5 days, we will delve into the trends, momentum, volatility, and volume aspects to provide a comprehensive outlook on the possible stock price movement in the coming days. By examining key indicators such as moving averages, MACD, RSI, Bollinger Bands, and OBV, we aim to offer valuable insights and predictions for informed decision-making.
Trend Analysis:
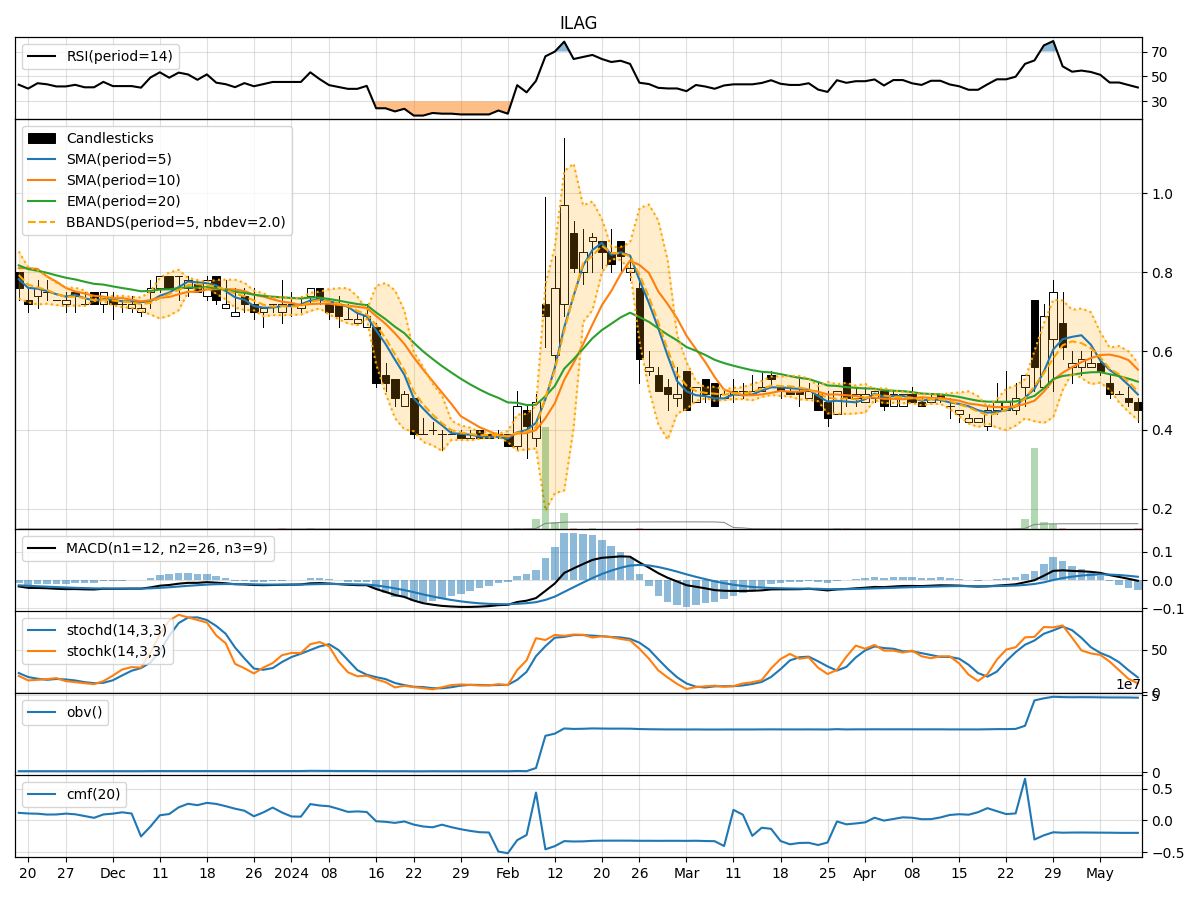
- Moving Averages (MA): The 5-day MA has been consistently declining, indicating a downward trend in the stock price.
- MACD: The MACD line has been decreasing, with the MACD histogram also showing a downward trend, suggesting bearish momentum.
Momentum Analysis:
- RSI: The RSI has been decreasing and is currently below 50, indicating weakening momentum.
- Stochastic Oscillator: Both %K and %D have been declining, signaling a bearish momentum.
Volatility Analysis:
- Bollinger Bands (BB): The stock price has been consistently below the lower Bollinger Band, indicating oversold conditions and potential for a reversal.
Volume Analysis:
- On-Balance Volume (OBV): The OBV has been decreasing, suggesting selling pressure in the stock.
Key Observations:
- The stock is in a clear downtrend based on moving averages and MACD.
- Momentum indicators like RSI and Stochastic Oscillator point towards bearish sentiment.
- Volatility is high as the stock price is consistently below the lower Bollinger Band.
- The OBV reflects selling pressure as volume decreases.
Conclusion:
Based on the analysis of technical indicators, the next few days' possible stock price movement for ILAG is likely to be downward. The stock shows signs of continued bearish momentum, with oversold conditions and selling pressure evident. Investors should exercise caution and consider waiting for a potential reversal or stabilization before considering any long positions.