Technical Analysis of IGIC 2024-05-10
Overview:
In analyzing the technical indicators for IGIC over the last 5 days, we will delve into the trend, momentum, volatility, and volume indicators to provide a comprehensive outlook on the possible stock price movement. By examining these key aspects, we aim to offer valuable insights and predictions for the upcoming trading days.
Trend Analysis:
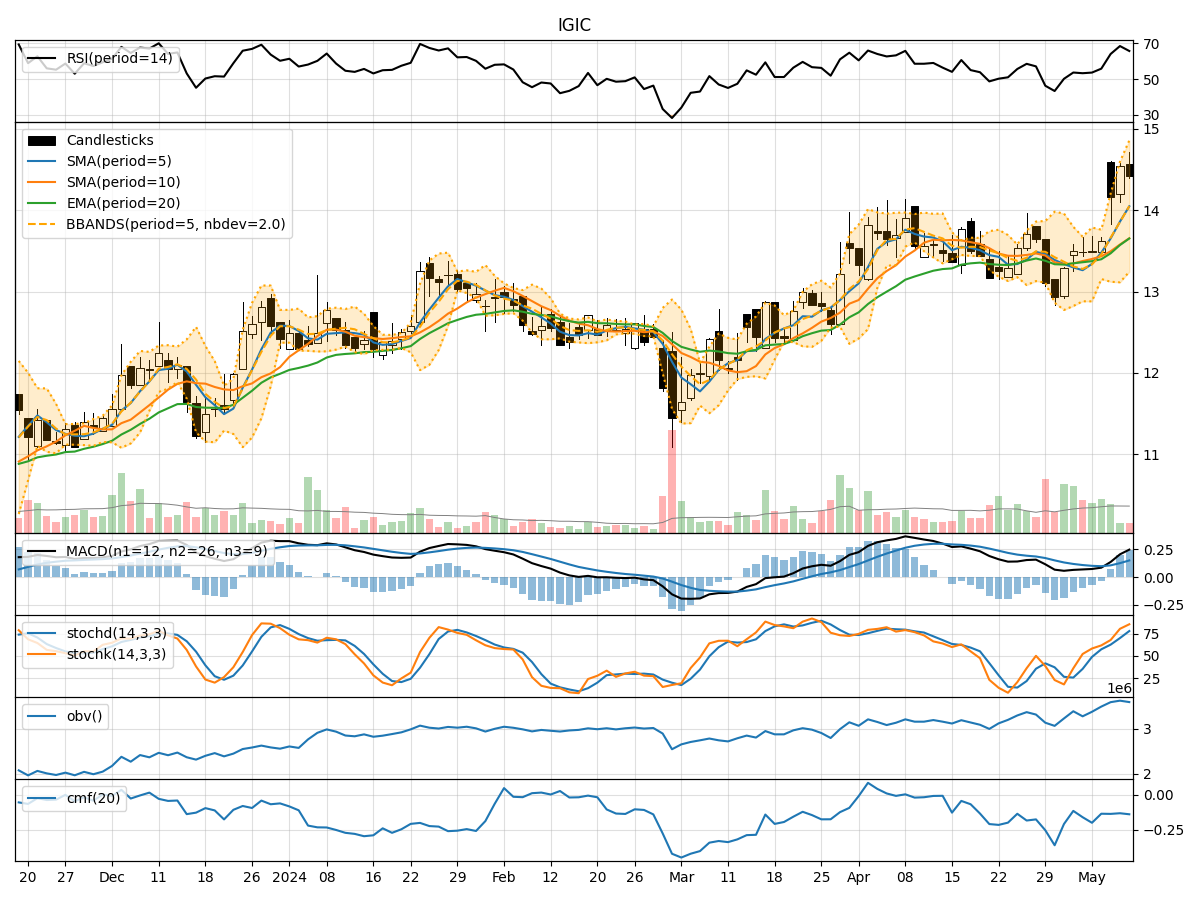
- Moving Averages (MA): The 5-day Moving Average (MA) has been consistently trending upwards, indicating a positive momentum in the stock price.
- MACD: The Moving Average Convergence Divergence (MACD) has shown an increasing trend, with the MACD line consistently above the signal line, suggesting a bullish momentum.
- EMA: The Exponential Moving Average (EMA) has also been on an upward trajectory, further supporting the bullish outlook.
Momentum Analysis:
- RSI: The Relative Strength Index (RSI) has been in the neutral to slightly overbought territory, indicating a balanced momentum in the stock.
- Stochastic Oscillator: Both %K and %D lines of the Stochastic Oscillator have been in the overbought zone, suggesting a potential reversal or consolidation in the near term.
- Williams %R: The Williams %R is in the oversold region, signaling a possible buying opportunity.
Volatility Analysis:
- Bollinger Bands: The Bollinger Bands have shown an expanding pattern, indicating increased volatility in the stock price.
- Bollinger %B: The %B indicator has been fluctuating within a range, reflecting the volatility in the stock.
Volume Analysis:
- On-Balance Volume (OBV): The OBV has shown a mixed trend, indicating indecision among investors regarding the stock.
- Chaikin Money Flow (CMF): The CMF has been negative, suggesting a net outflow of money from the stock.
Key Observations:
- The trend indicators suggest a bullish sentiment in the stock, supported by the positive movement in moving averages and MACD.
- Momentum indicators show a mixed picture, with RSI in a neutral zone, Stochastic Oscillator indicating overbought conditions, and Williams %R signaling oversold levels.
- Volatility has increased, as seen in the expanding Bollinger Bands, which may lead to larger price swings.
- Volume indicators reflect uncertainty, with OBV showing mixed signals and CMF indicating a negative money flow.
Conclusion:
Based on the analysis of technical indicators, the stock price of IGIC is likely to experience further upward movement in the coming days. The bullish trend supported by moving averages and MACD suggests a positive outlook. However, caution is advised due to the mixed signals from momentum and volume indicators, as well as the increased volatility in the stock price. Traders should closely monitor key levels and wait for confirmation before making trading decisions.