Technical Analysis of IFBD 2024-05-10
Overview:
In analyzing the technical indicators for IFBD over the last 5 days, we will delve into the trend, momentum, volatility, and volume indicators to provide a comprehensive outlook on the possible stock price movement in the coming days. By examining these key indicators, we aim to offer valuable insights and recommendations for potential investors.
Trend Analysis:
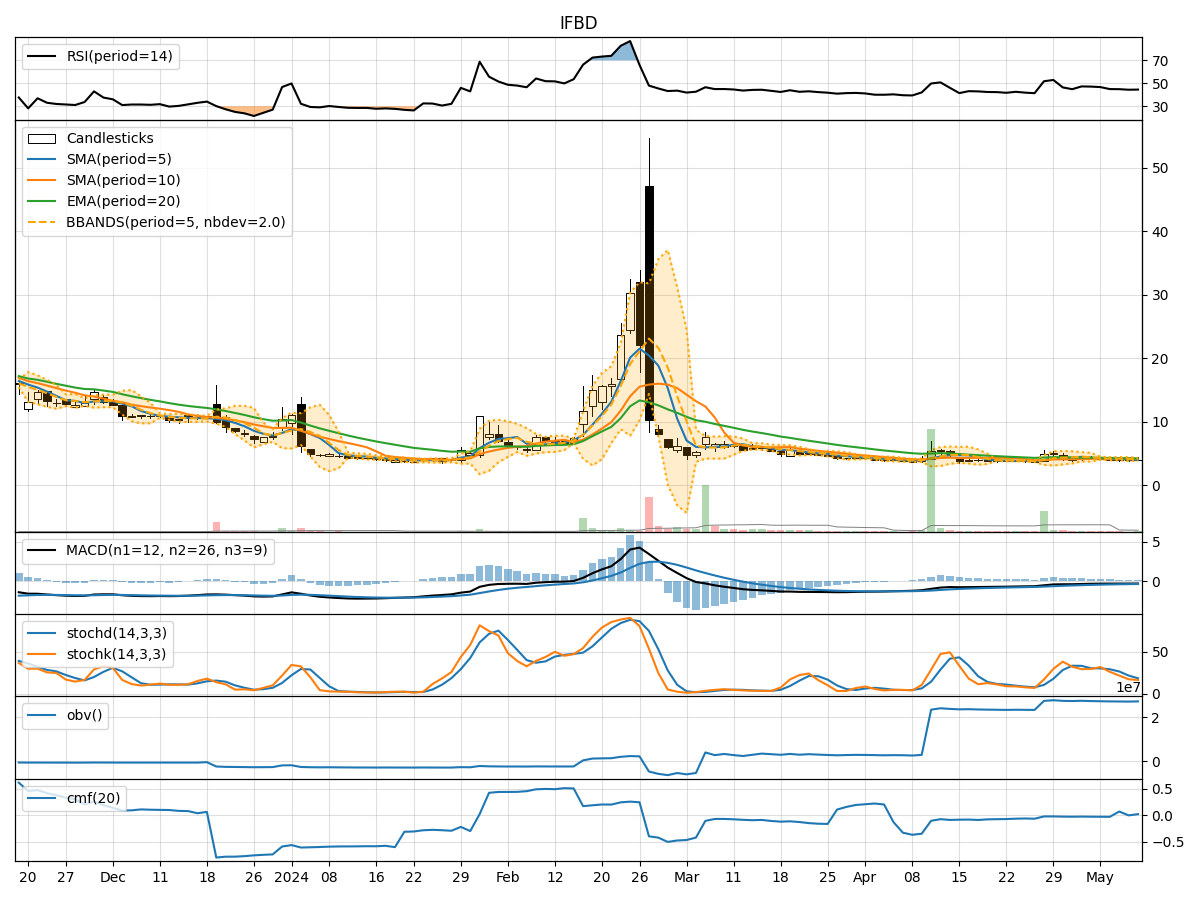
- Moving Averages (MA): The 5-day MA has been fluctuating around the closing prices, indicating short-term price trends. The SMA(10) and EMA(20) show a downward trend, suggesting a bearish sentiment in the medium to long term.
- MACD and Signal Line: The MACD has been negative, with the MACD line consistently below the signal line, indicating a bearish trend in the stock price momentum.
Momentum Analysis:
- RSI: The RSI values have been hovering around the mid-range, indicating a lack of strong momentum in either direction.
- Stochastic Oscillator: Both %K and %D values have been decreasing, suggesting a weakening momentum in the stock price movement.
- Williams %R: The Williams %R values have been consistently in the oversold territory, indicating a potential reversal or bounce in the stock price.
Volatility Analysis:
- Bollinger Bands: The stock price has been trading within the lower Bollinger Band, indicating a potential oversold condition. The narrowing of the bands suggests decreasing volatility.
- Bollinger %B: The %B values have been below 0.2, indicating a potential buying opportunity as the stock may be oversold.
Volume Analysis:
- On-Balance Volume (OBV): The OBV has been fluctuating, indicating mixed buying and selling pressure in the stock.
- Chaikin Money Flow (CMF): The CMF has been negative, suggesting a bearish money flow in the stock.
Key Observations and Opinions:
- Trend: The trend indicators point towards a bearish sentiment in the stock price, with moving averages and MACD signaling a downward trend.
- Momentum: The momentum indicators suggest a lack of strong momentum in either direction, with potential for a reversal given the oversold conditions.
- Volatility: The narrowing Bollinger Bands and low %B values indicate decreased volatility and a potential buying opportunity.
- Volume: The mixed OBV and negative CMF suggest a neutral to bearish volume sentiment in the stock.
Conclusion:
Based on the analysis of the technical indicators, the stock price of IFBD is likely to experience further downward movement in the coming days. The bearish trend indicated by moving averages and MACD, coupled with the lack of strong momentum and bearish volume sentiment, suggest a potential continuation of the current downtrend. Traders should exercise caution and consider short-term selling opportunities or wait for a clear reversal signal before considering long positions.