Technical Analysis of ICG 2024-05-10
Overview:
In analyzing the technical indicators for ICG over the last 5 days, we will delve into the trend, momentum, volatility, and volume indicators to provide a comprehensive assessment of the stock's potential price movement. By examining these key factors, we aim to offer valuable insights and predictions for the upcoming days.
Trend Indicators:
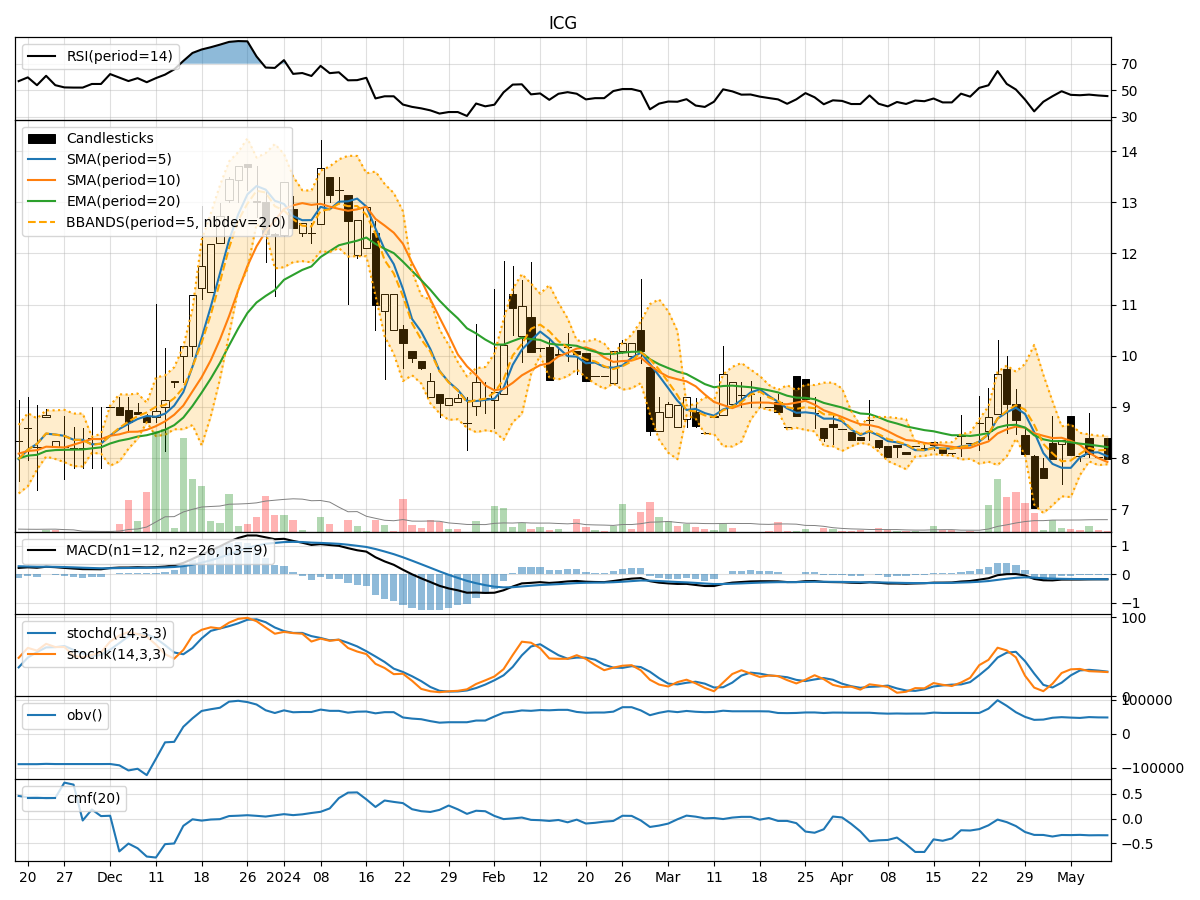
- Moving Averages (MA): The 5-day MA has been fluctuating around the closing prices, indicating short-term price trends. The SMA(10) and EMA(20) show a downward trend, suggesting a bearish sentiment in the medium to long term.
- MACD: The MACD line has been consistently negative, indicating a bearish trend. The MACD Histogram has also been decreasing, further supporting the bearish view.
Momentum Indicators:
- RSI: The RSI has been hovering around the 45-50 range, indicating a neutral momentum with a slight bearish bias.
- Stochastic Oscillator: Both %K and %D have been declining, signaling a bearish momentum.
- Williams %R: The indicator has been in the oversold territory, suggesting a potential reversal or continuation of the bearish trend.
Volatility Indicators:
- Bollinger Bands: The bands have been narrowing, indicating decreasing volatility. The price has been trading within the bands, suggesting a period of consolidation.
- Bollinger %B: The %B indicator has been decreasing, reflecting a potential downtrend or consolidation phase.
Volume Indicators:
- On-Balance Volume (OBV): The OBV has been negative, indicating selling pressure in the stock.
- Chaikin Money Flow (CMF): The CMF has been consistently negative, suggesting a bearish sentiment in the market.
Key Observations:
- The trend indicators point towards a bearish sentiment in the short to medium term.
- Momentum indicators show a neutral to bearish momentum, with potential for further downside.
- Volatility indicators suggest a period of consolidation with decreasing volatility.
- Volume indicators indicate selling pressure and a bearish market sentiment.
Conclusion:
Based on the analysis of the technical indicators, the overall outlook for ICG in the next few days is bearish. The stock is likely to experience further downside movement or consolidation, with a potential for a continuation of the current bearish trend. Traders and investors should exercise caution and consider short-term selling strategies or wait for a clearer trend reversal signal before considering long positions.