Technical Analysis of ICCM 2024-05-10
Overview:
In analyzing the technical indicators for ICCM over the last 5 days, we will delve into the trend, momentum, volatility, and volume indicators to provide a comprehensive outlook on the possible stock price movement in the coming days. By examining these key aspects, we aim to offer valuable insights and predictions for potential investors.
Trend Analysis:
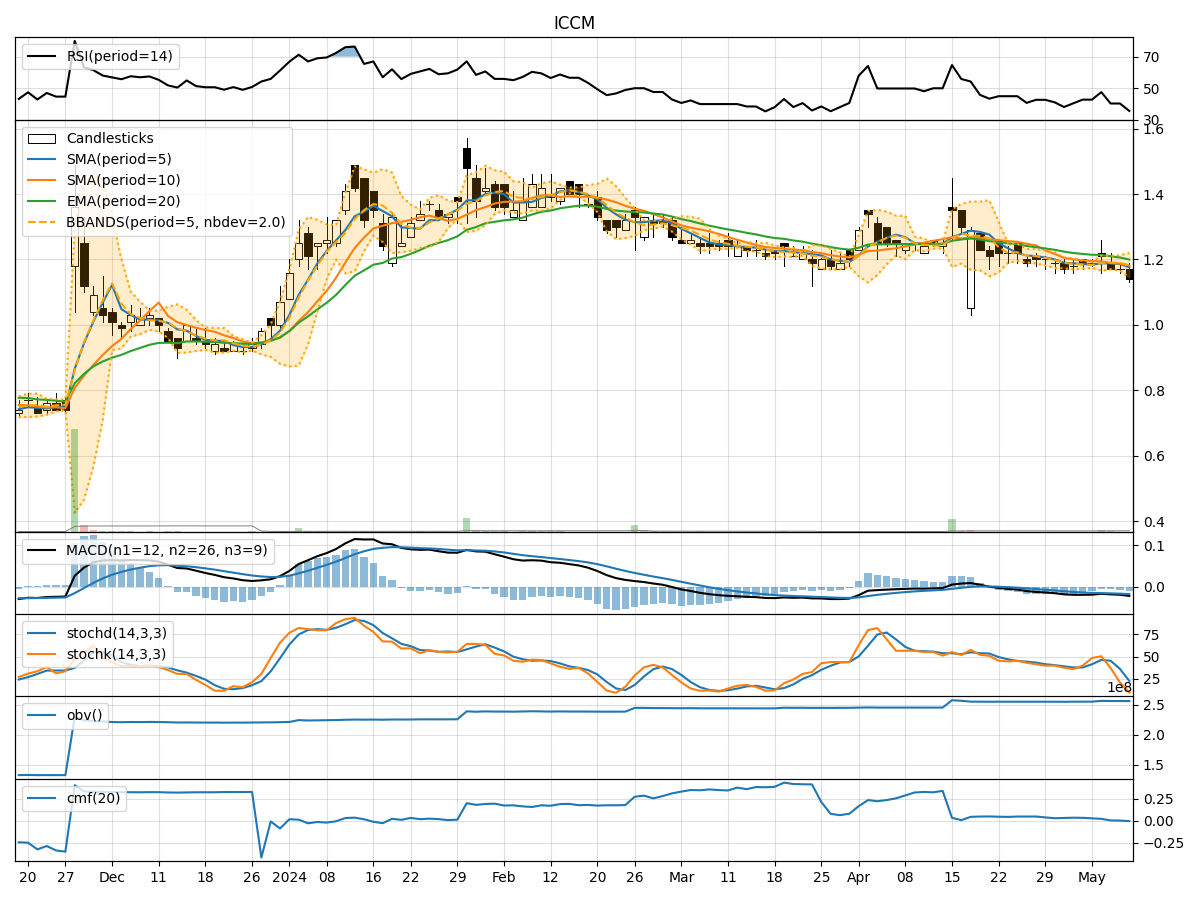
- Moving Averages (MA): The 5-day MA has been slightly below the closing prices, indicating a short-term downtrend.
- MACD: The MACD line has been consistently negative, suggesting a bearish momentum in the stock.
- EMA: The EMA has been declining, further supporting the bearish trend in the stock.
Momentum Analysis:
- RSI: The RSI has been hovering around the 40-50 range, indicating a neutral sentiment with no clear overbought or oversold conditions.
- Stochastic Oscillator: Both %K and %D have been decreasing, signaling a potential weakening momentum.
- Williams %R: The indicator has been in oversold territory, suggesting a bearish sentiment.
Volatility Analysis:
- Bollinger Bands (BB): The bands have been narrowing, indicating decreasing volatility in the stock price.
- BB Percentage (BBP): The percentage has been relatively low, suggesting a lack of significant price movements.
Volume Analysis:
- On-Balance Volume (OBV): The OBV has been relatively stable, indicating no significant divergence between volume and price movements.
- Chaikin Money Flow (CMF): The CMF has been positive but decreasing, reflecting a potential outflow of money from the stock.
Key Observations:
- The stock is currently in a short-term downtrend based on moving averages and MACD.
- Momentum indicators suggest a neutral to bearish sentiment with no clear signals of a reversal.
- Volatility has been decreasing, indicating a lack of significant price fluctuations.
- Volume indicators show stability in volume but a potential decrease in buying pressure.
Conclusion:
Based on the analysis of the technical indicators, the stock is likely to continue its downward trend in the coming days. The momentum remains weak, and there are no strong signals of a reversal in the near term. Additionally, the decreasing volatility and potential outflow of money suggest a lack of significant buying interest. Therefore, investors should exercise caution and consider waiting for more positive signals before considering any bullish positions.