Technical Analysis of IBKR 2024-05-03
Overview:
In the last 5 trading days, IBKR stock has shown a mix of price movements and technical indicators. The stock price has fluctuated within a range, with some indicators suggesting potential bullish momentum while others indicate a possible consolidation phase. Let's delve deeper into the analysis of trend, momentum, volatility, and volume indicators to determine the possible future stock price movement.
Trend Analysis:
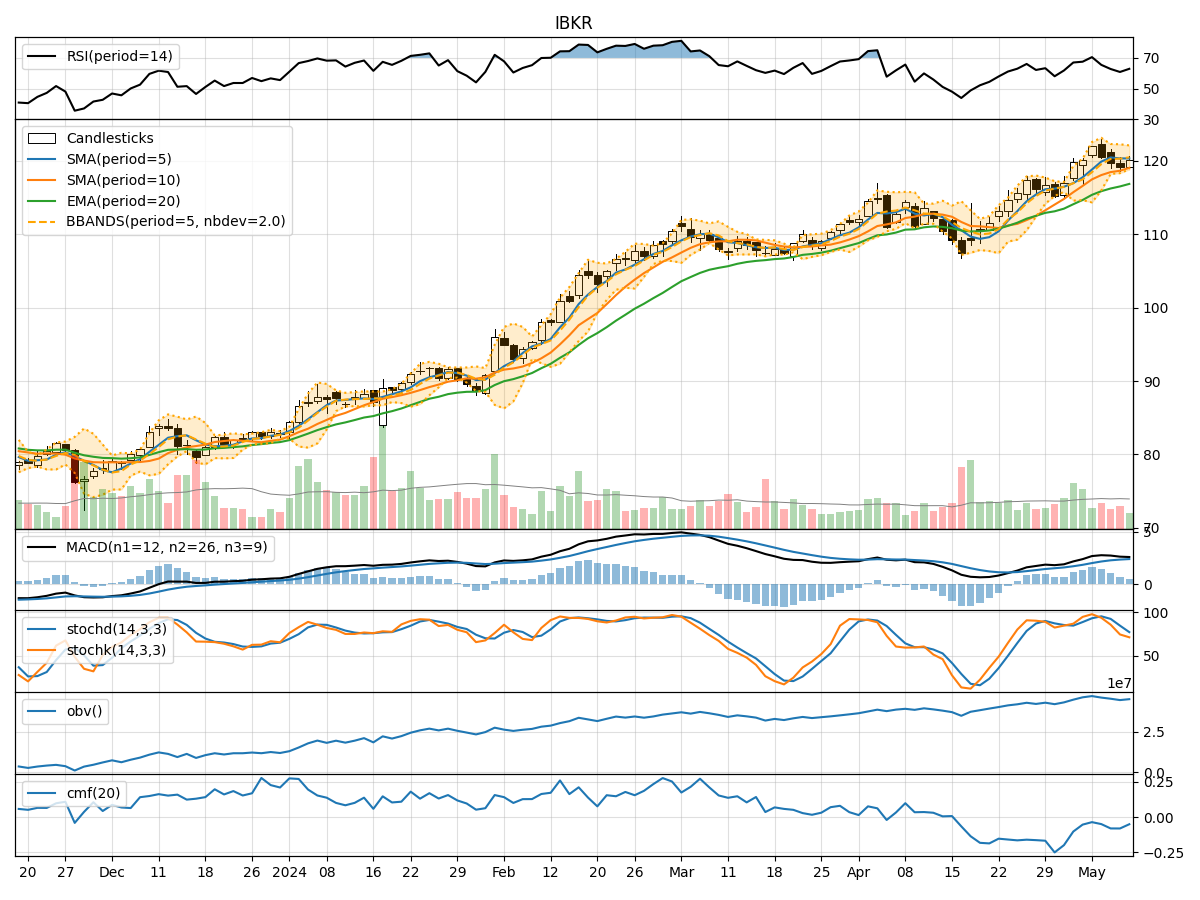
- Moving Averages (MA): The 5-day Moving Average (MA) has been trending above the Simple Moving Average (SMA) and Exponential Moving Average (EMA), indicating a short-term bullish trend.
- MACD: The MACD line has been consistently above the signal line, suggesting bullish momentum in the stock price.
- MACD Histogram: The MACD Histogram has shown an increasing trend, indicating strengthening bullish momentum.
Momentum Analysis:
- RSI: The Relative Strength Index (RSI) has been fluctuating in the overbought territory, suggesting a potential overbought condition.
- Stochastic Oscillator: Both %K and %D lines of the Stochastic Oscillator have been in the overbought zone, indicating a strong bullish momentum.
- Williams %R: The Williams %R indicator has been hovering near the oversold territory, suggesting a potential reversal in the short term.
Volatility Analysis:
- Bollinger Bands: The Bollinger Bands have widened, indicating increased volatility in the stock price.
- Bollinger %B: The %B indicator has been fluctuating within a range, suggesting potential price reversals.
Volume Analysis:
- On-Balance Volume (OBV): The OBV indicator has shown mixed signals, indicating indecision among market participants.
- Chaikin Money Flow (CMF): The CMF has been negative, suggesting a bearish money flow in the stock.
Key Observations:
- The trend indicators suggest a short-term bullish bias in the stock price.
- Momentum indicators show conflicting signals, with RSI indicating potential overbought conditions and Stochastic Oscillator signaling strong bullish momentum.
- Volatility indicators point towards increased price fluctuations.
- Volume indicators reflect mixed sentiment among investors.
Conclusion:
Based on the analysis of technical indicators, the next few days' possible stock price movement for IBKR is likely to be bullish in the short term. However, caution is advised due to conflicting signals from momentum indicators and negative money flow indicated by the CMF. Traders should closely monitor price action and key support/resistance levels for potential entry and exit points.
Disclaimer:
This analysis is based on historical data and technical indicators, and market conditions can change rapidly. It is essential to consider other factors and conduct thorough research before making any investment decisions. Consulting with a financial advisor is recommended for personalized investment advice tailored to individual risk tolerance and financial goals.