Technical Analysis of HUDI 2024-05-10
Overview:
In analyzing the technical indicators for HUDI stock over the last 5 days, we will delve into the trend, momentum, volatility, and volume indicators to provide a comprehensive outlook on the possible future stock price movement. By examining these key indicators, we aim to offer valuable insights and recommendations for potential trading strategies.
Trend Analysis:
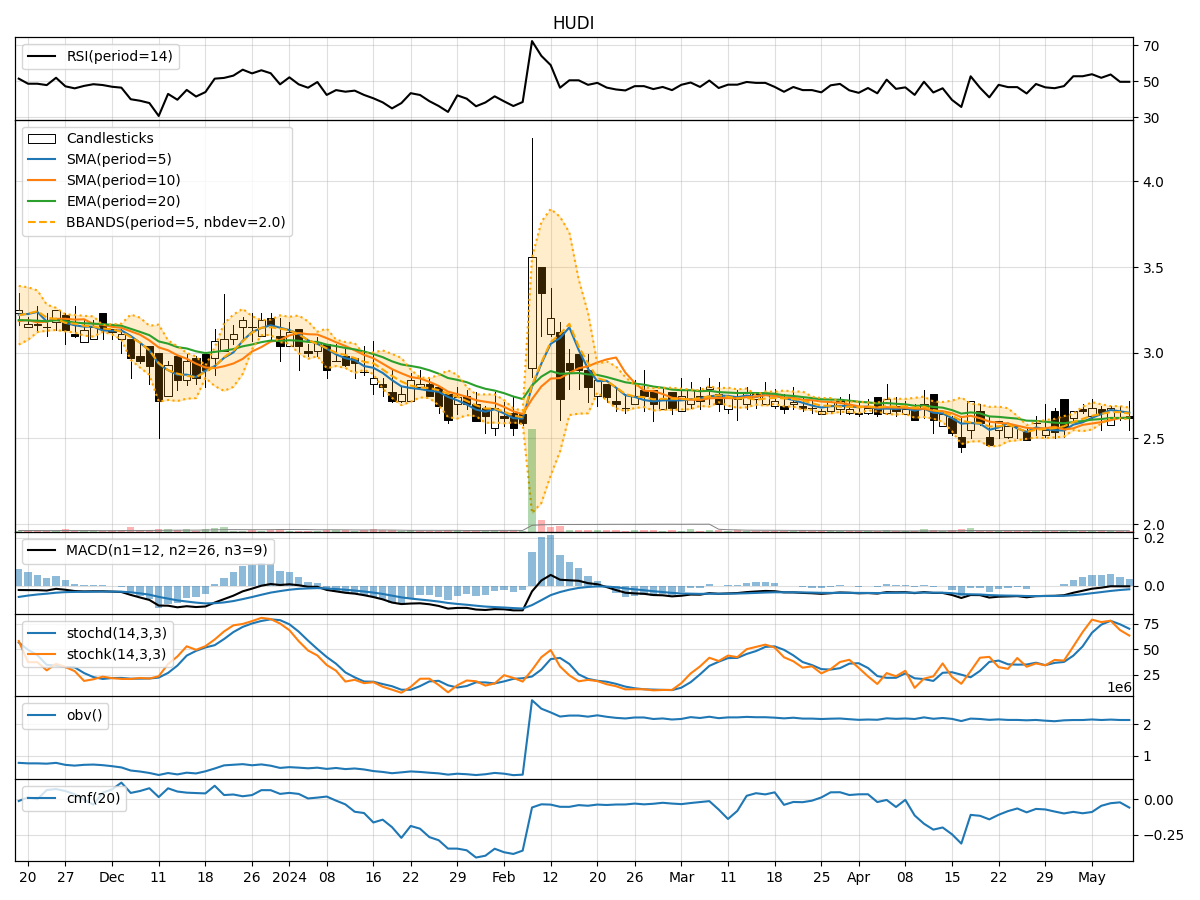
- Moving Averages (MA): The 5-day Moving Average (MA) has been relatively stable around the current stock price, indicating a neutral trend.
- MACD: The Moving Average Convergence Divergence (MACD) has been consistently negative, suggesting a bearish trend.
- EMA: The Exponential Moving Average (EMA) has shown a slight upward trend, but the overall trend remains neutral.
Key Observation: The trend indicators point towards a neutral to slightly bearish trend in the short term.
Momentum Analysis:
- RSI: The Relative Strength Index (RSI) has been fluctuating around the 50 level, indicating a lack of strong momentum.
- Stochastic Oscillator: Both %K and %D of the Stochastic Oscillator have been declining, signaling a weakening momentum.
- Williams %R: The Williams %R is in oversold territory, suggesting a potential reversal in momentum.
Key Observation: Momentum indicators reflect a lack of strong bullish momentum and a potential shift towards a bearish sentiment.
Volatility Analysis:
- Bollinger Bands: The Bollinger Bands have shown narrowing volatility, indicating a period of consolidation.
- Bollinger %B: The %B indicator is hovering around the middle range, suggesting a balanced volatility level.
Key Observation: Volatility indicators suggest a period of consolidation and stability in the stock price.
Volume Analysis:
- On-Balance Volume (OBV): The OBV has been relatively flat, indicating a balance between buying and selling pressure.
- Chaikin Money Flow (CMF): The CMF has been negative, reflecting a slight outflow of money from the stock.
Key Observation: Volume indicators suggest a lack of significant buying or selling pressure in the stock.
Conclusion:
Based on the analysis of trend, momentum, volatility, and volume indicators, the overall outlook for HUDI stock in the next few days is sideways with a slight bearish bias. The stock is likely to experience continued consolidation with a potential downside bias due to the bearish signals from the MACD and Stochastic Oscillator.
Recommendation: Traders may consider adopting a cautious approach and wait for clearer signals before making significant trading decisions. It is advisable to closely monitor key support and resistance levels for potential entry or exit points.
Key Words: Sideways, Slight Bearish Bias, Consolidation.