Technical Analysis of HTCR 2024-05-10
Overview:
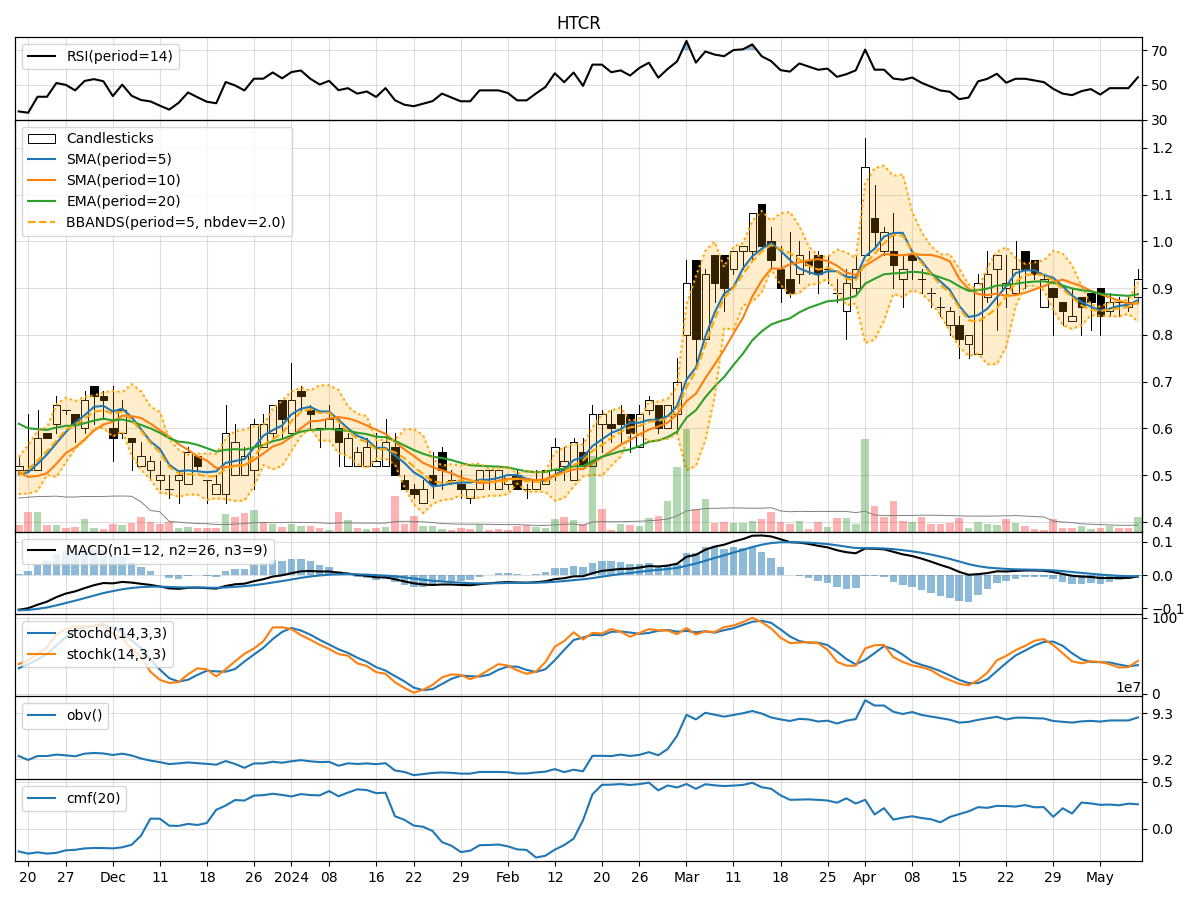
In analyzing the technical indicators for HTCR over the last 5 days, we will delve into the trend, momentum, volatility, and volume indicators to provide a comprehensive assessment of the stock's potential price movement. By examining these key factors, we aim to offer valuable insights and predictions for the next few days.
Trend Analysis:
- Moving Averages (MA): The 5-day Moving Average (MA) has been gradually increasing, indicating a short-term uptrend in the stock price.
- MACD: The Moving Average Convergence Divergence (MACD) has been consistently negative, suggesting a bearish momentum in the stock.
- EMA: The Exponential Moving Average (EMA) has been relatively stable, showing a neutral trend in the stock price.
Momentum Analysis:
- RSI: The Relative Strength Index (RSI) has been increasing, indicating a strengthening momentum in the stock.
- Stochastic Oscillator: Both %K and %D of the Stochastic Oscillator have been fluctuating, reflecting indecision in the stock's momentum.
- Williams %R: The Williams %R is currently in the oversold territory, suggesting a potential reversal in the stock price.
Volatility Analysis:
- Bollinger Bands: The Bollinger Bands have widened, indicating increased volatility in the stock price.
- Bollinger %B: The %B indicator is above 0.8, suggesting that the stock is trading near the upper Bollinger Band, potentially indicating an overbought condition.
Volume Analysis:
- On-Balance Volume (OBV): The OBV has been relatively flat, indicating a balance between buying and selling pressure in the stock.
- Chaikin Money Flow (CMF): The CMF has been positive, suggesting that money is flowing into the stock.
Key Observations:
- The stock is currently exhibiting mixed signals across different indicators, with some pointing towards a bullish momentum while others suggest a bearish sentiment.
- The increasing RSI and potential reversal indicated by Williams %R could signal a short-term bullish movement.
- However, the negative MACD and fluctuating Stochastic Oscillator indicate underlying bearish pressure in the stock.
Conclusion:
Based on the analysis of the technical indicators, the next few days for HTCR could see mixed and volatile price movements. While there are indications of a potential short-term bullish momentum, the overall trend remains uncertain due to conflicting signals from various indicators. Traders and investors should exercise caution and closely monitor key levels such as the Bollinger Bands and RSI for potential entry or exit points.