Technical Analysis of HRYU 2024-05-10
Overview:
In analyzing the technical indicators for HRYU over the last 5 days, we will delve into the trend, momentum, volatility, and volume indicators to provide a comprehensive outlook on the possible stock price movement in the coming days. By examining these key aspects, we aim to offer valuable insights and recommendations for potential investors.
Trend Analysis:
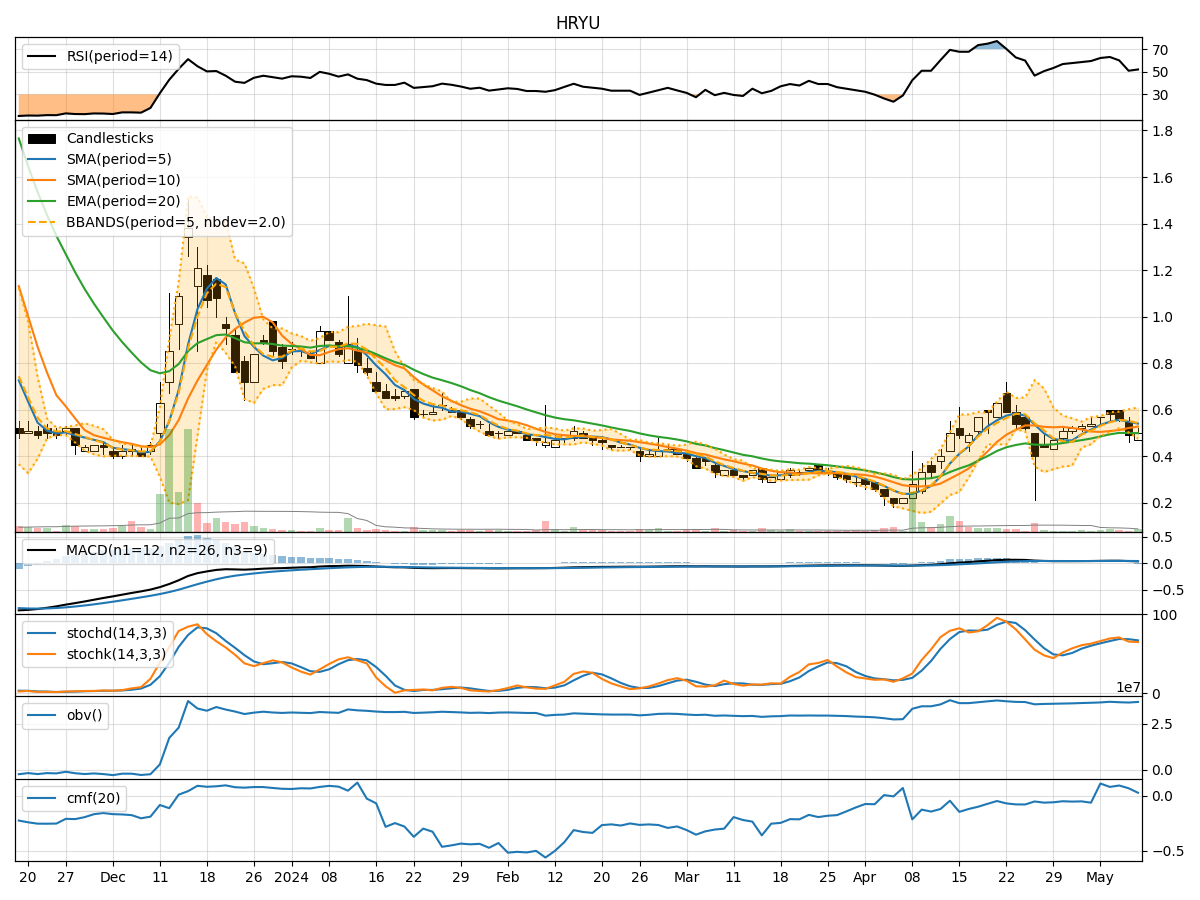
- Moving Averages (MA): The 5-day MA has been fluctuating around the current price, indicating short-term price volatility. The SMA(10) and EMA(20) have shown a slight upward trend, suggesting a potential bullish sentiment in the medium to long term.
- MACD and Signal Line: The MACD has been positive, indicating a bullish momentum. The MACD Histogram has been decreasing, signaling a potential slowdown in the bullish momentum.
Momentum Analysis:
- RSI: The RSI has been fluctuating around the 50 level, indicating a neutral momentum in the stock.
- Stochastic Oscillator: Both %K and %D have been hovering around the overbought territory, suggesting a potential reversal in the short term.
- Williams %R: The Williams %R has been fluctuating in the oversold and overbought zones, indicating mixed momentum signals.
Volatility Analysis:
- Bollinger Bands: The stock price has been trading within the Bollinger Bands, with the bands widening, indicating increased volatility.
- Bollinger %B: The %B indicator has been fluctuating, suggesting potential price reversals in the short term.
Volume Analysis:
- On-Balance Volume (OBV): The OBV has shown a slight increase, indicating buying pressure in the stock.
- Chaikin Money Flow (CMF): The CMF has been positive but decreasing, suggesting a potential decrease in buying pressure.
Key Observations and Opinions:
- Trend: The stock is showing signs of a bullish trend in the medium to long term.
- Momentum: The momentum is currently neutral with mixed signals from the oscillators.
- Volatility: Volatility has been increasing, indicating potential price fluctuations.
- Volume: Buying pressure is present but may be weakening based on the OBV and CMF indicators.
Conclusion:
Based on the analysis of the technical indicators, the stock price of HRYU is likely to experience further upward movement in the coming days. The bullish trend indicated by the moving averages and MACD, coupled with the positive OBV, suggests a potential price appreciation. However, investors should remain cautious of the mixed momentum signals and increasing volatility, which could lead to short-term price fluctuations. Overall, a bullish outlook is recommended for the next few days.