Technical Analysis of HON 2024-05-10
Overview:
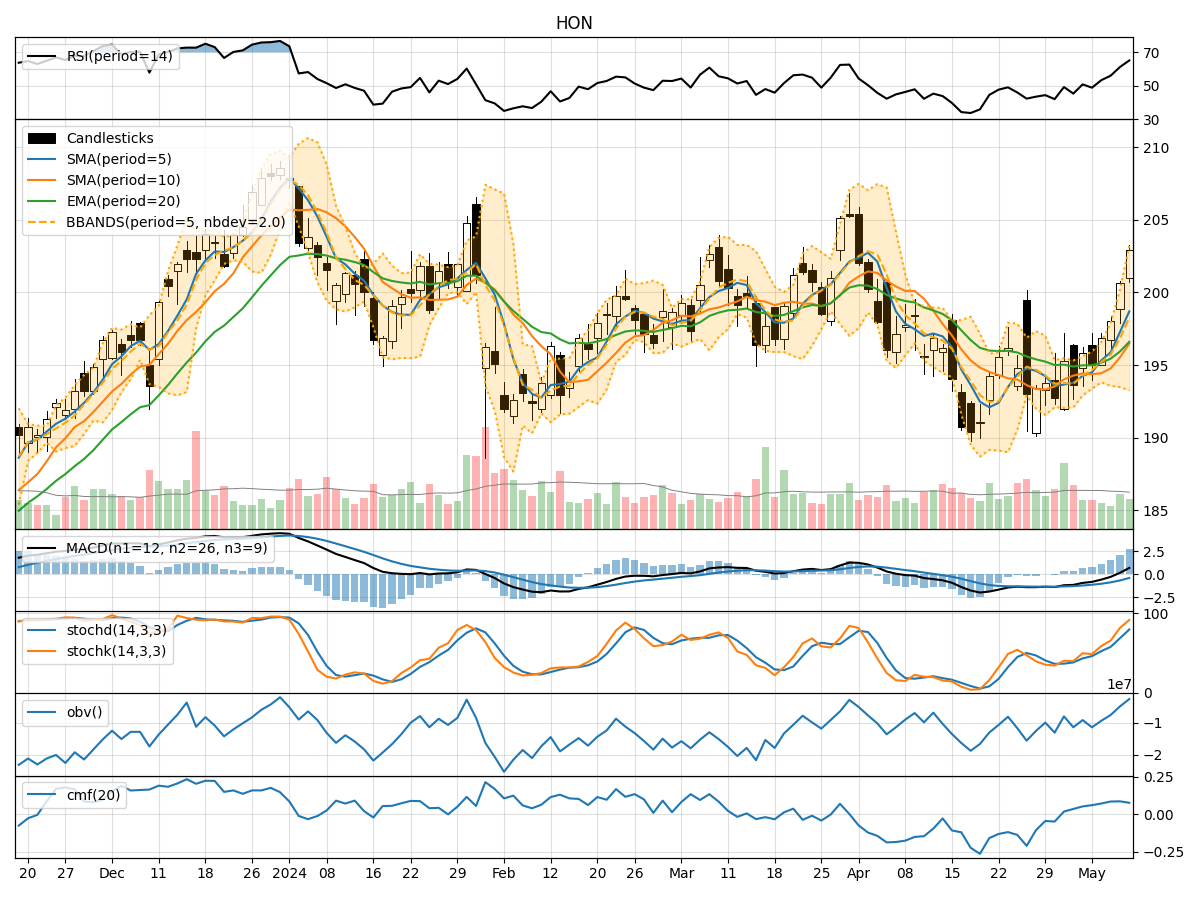
In the last 5 trading days, Honeywell International Inc. (HON) has shown a consistent uptrend in its stock price, accompanied by increasing trading volumes. The moving averages have been trending upwards, indicating a positive momentum in the stock. Momentum indicators such as RSI and Stochastic oscillators are also showing strength in the stock's price movement. Volatility indicators suggest an expansion in price range, while volume indicators like OBV and CMF reflect positive accumulation by investors.
Trend Indicators:
- Moving Averages (MA): The 5-day MA has been consistently above the longer-term SMAs and EMAs, indicating a bullish trend in the stock price.
- MACD: The MACD line has been consistently above the signal line, with both lines trending upwards, indicating a strengthening bullish momentum.
Momentum Indicators:
- RSI: The RSI has been consistently above 50, indicating bullish momentum in the stock.
- Stochastic Oscillators: Both %K and %D lines are in the overbought zone, suggesting a strong bullish momentum.
Volatility Indicators:
- Bollinger Bands (BB): The widening of the Bollinger Bands suggests increasing volatility in the stock price.
Volume Indicators:
- On-Balance Volume (OBV): The OBV has been steadily increasing, indicating strong buying pressure and accumulation by investors.
- Chaikin Money Flow (CMF): The CMF has been positive, indicating that money is flowing into the stock.
Key Observations:
- The stock is in a strong uptrend, supported by moving averages and MACD.
- Momentum indicators like RSI and Stochastic oscillators are in the overbought zone, indicating a strong bullish sentiment.
- Volatility is increasing, which could lead to larger price movements.
- Volume indicators show positive accumulation and buying pressure.
Conclusion:
Based on the technical indicators and analysis: - The stock is in a strong upward trend with bullish momentum. - Expect the stock price to continue its upward movement in the next few days. - There may be short-term pullbacks or consolidations due to overbought conditions, but the overall trend remains bullish. - Consider buying opportunities on dips to ride the upward trend. - Monitor the stock closely for any signs of trend reversal, especially if the momentum indicators start to diverge from the price action.
Final Recommendation:
Bullish View: The technical analysis suggests a bullish outlook for HON in the next few days. Consider holding or accumulating the stock for potential further upside.