Technical Analysis of HOLI 2024-05-10
Overview:
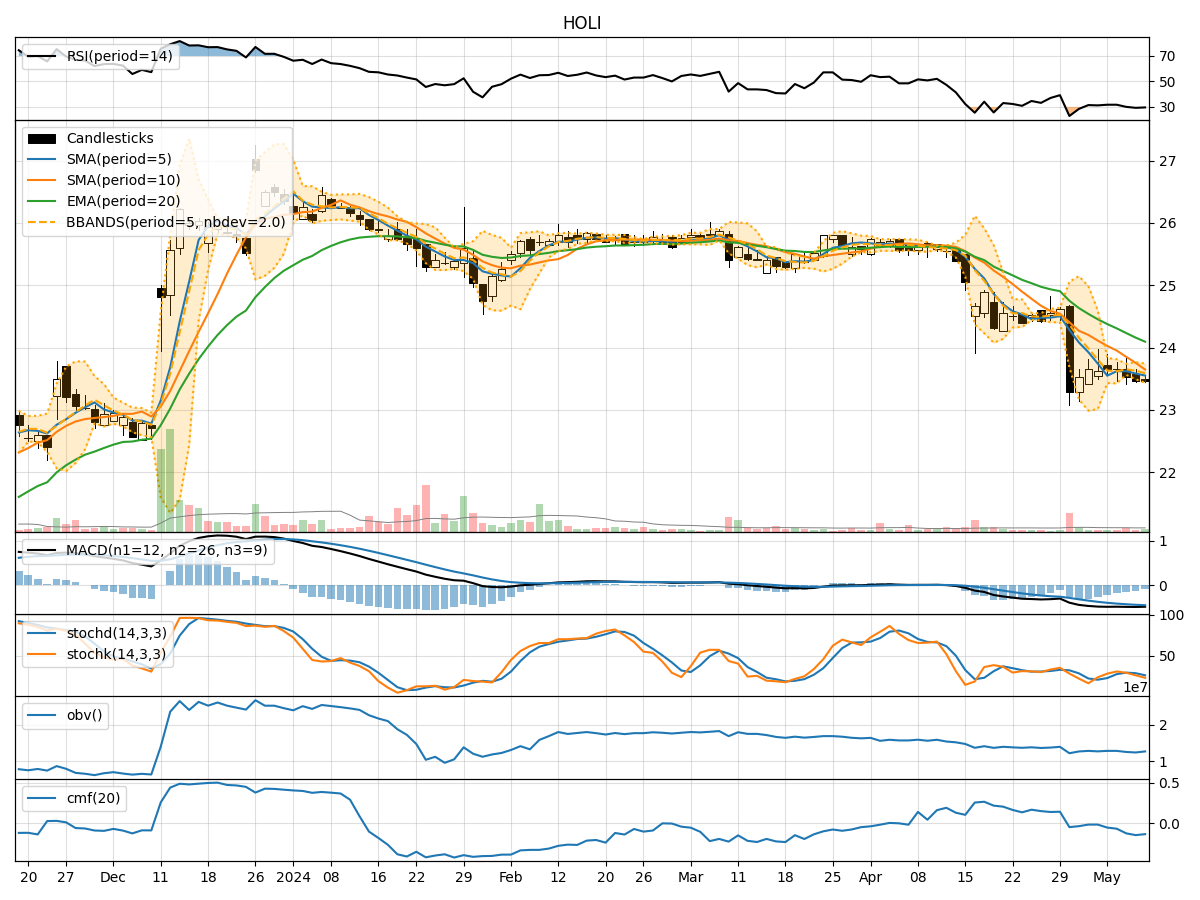
In the last 5 trading days, HOLI stock has shown a slight downward trend in its closing price, accompanied by fluctuating volume levels. The trend indicators suggest a bearish sentiment with the moving averages and MACD signaling a potential continuation of the downward movement. Momentum indicators also indicate a bearish momentum, while volatility indicators show a narrowing Bollinger Bands, indicating decreased price volatility. Volume indicators reflect a negative OBV and CMF, suggesting selling pressure.
Trend Indicators:
- Moving Averages (MA): The 5-day MA is below both the 10-day SMA and the 20-day EMA, indicating a short-term bearish trend.
- MACD: The MACD line is below the signal line, confirming the bearish sentiment.
- MACD Histogram: The MACD histogram is negative, indicating a bearish momentum.
Momentum Indicators:
- RSI: The RSI is below 50, indicating bearish momentum.
- Stochastic Oscillator: Both %K and %D are in oversold territory, suggesting a bearish sentiment.
- Williams %R: The indicator is in oversold territory, signaling a bearish momentum.
Volatility Indicators:
- Bollinger Bands (BB): The narrowing of the Bollinger Bands suggests decreasing volatility and a potential upcoming price breakout.
- Bollinger %B: The %B is below 1, indicating the price is near the lower band, potentially oversold.
Volume Indicators:
- On-Balance Volume (OBV): The negative OBV suggests more selling volume than buying volume.
- Chaikin Money Flow (CMF): The negative CMF indicates a lack of buying pressure.
Conclusion:
Based on the technical indicators and analysis: - Trend: The trend indicators suggest a continuation of the bearish trend. - Momentum: Momentum indicators support the bearish sentiment. - Volatility: Decreasing volatility may precede a price breakout, potentially to the downside. - Volume: The negative OBV and CMF indicate ongoing selling pressure.
Overall Assessment:
Given the bearish signals across trend, momentum, volatility, and volume indicators, the next few days are likely to see a continued downward movement in HOLI stock price. Traders and investors should exercise caution and consider shorting or staying out of long positions until a clear reversal pattern emerges. It is advisable to closely monitor price action and key support levels for potential entry or exit points.