Technical Analysis of HITI 2024-05-10
Overview:
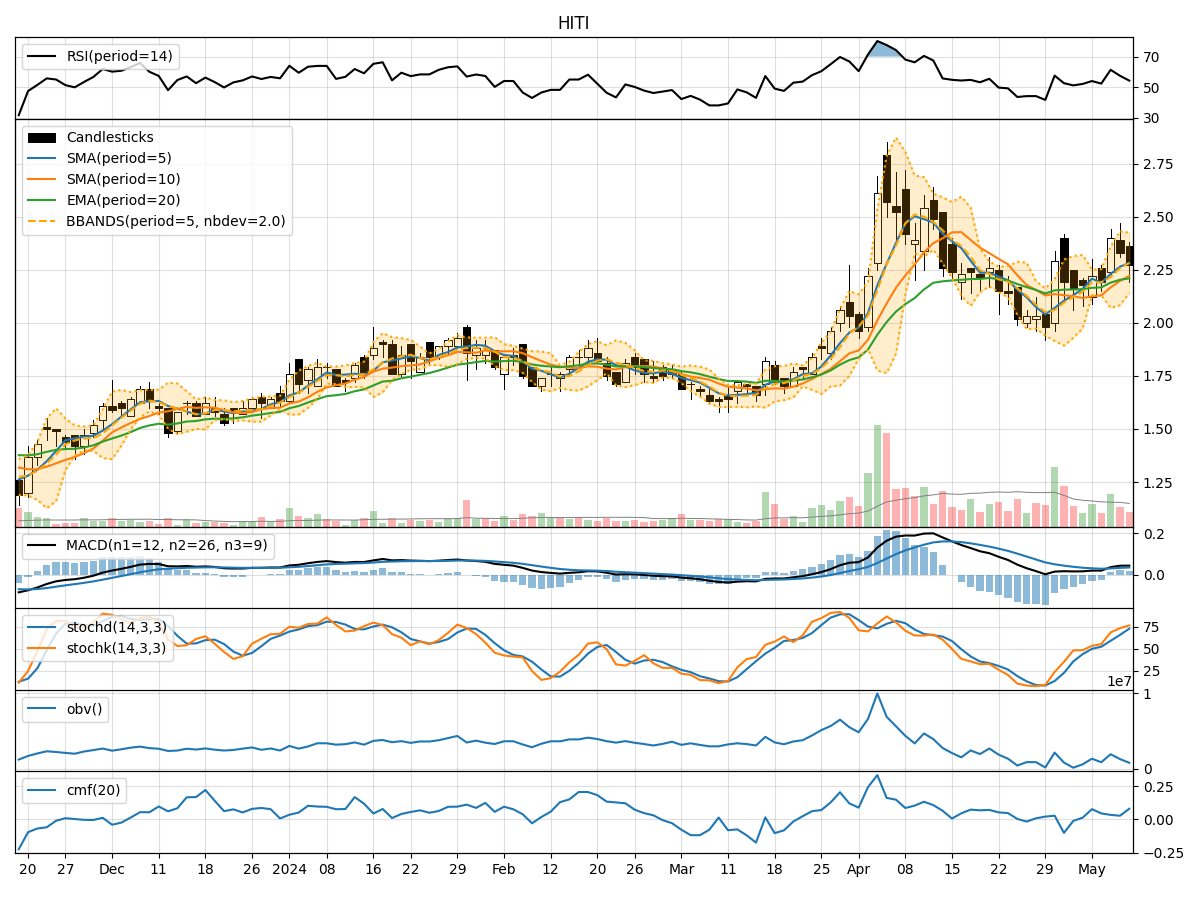
In analyzing the technical indicators for HITI over the last 5 days, we will delve into the trend, momentum, volatility, and volume indicators to provide a comprehensive outlook on the possible stock price movement. By examining these key aspects, we aim to offer valuable insights and predictions for the upcoming days.
Trend Analysis:
- Moving Averages (MA): The 5-day Moving Average (MA) has been steadily increasing, indicating a positive trend in the short term.
- MACD: The MACD line has been consistently above the signal line, suggesting bullish momentum.
- EMA: The Exponential Moving Average (EMA) has been on an upward trajectory, supporting the bullish sentiment.
Key Observation: The trend indicators point towards an upward movement in the stock price.
Momentum Analysis:
- RSI: The Relative Strength Index (RSI) has been fluctuating around the neutral zone, indicating indecision in the market.
- Stochastic Oscillator: Both %K and %D have been in the overbought territory, signaling a potential reversal.
- Williams %R: The Williams %R is in the oversold region, hinting at a possible buying opportunity.
Key Observation: The momentum indicators suggest a mixed sentiment with a slight bearish bias.
Volatility Analysis:
- Bollinger Bands (BB): The stock price has been trading within the bands, showing moderate volatility.
- Bollinger %B: The %B indicator has been fluctuating around the midline, indicating a balanced market sentiment.
Key Observation: Volatility indicators imply a sideways movement in the stock price.
Volume Analysis:
- On-Balance Volume (OBV): The OBV has been fluctuating, reflecting uncertainty in the buying and selling pressure.
- Chaikin Money Flow (CMF): The CMF has been positive but not significantly strong, suggesting a moderate inflow of money.
Key Observation: Volume indicators indicate a neutral stance with no clear direction.
Conclusion:
Based on the analysis of trend, momentum, volatility, and volume indicators, the overall outlook for HITI in the next few days is as follows: - Trend: Upward - Momentum: Mixed with a Bearish Bias - Volatility: Sideways - Volume: Neutral
Conclusion:
Considering the comprehensive analysis of technical indicators, the next few days for HITI are likely to see upward price movement in the short term, albeit with some bearish momentum and sideways volatility. Traders should exercise caution and closely monitor key levels to capitalize on potential opportunities while managing risks effectively.