Technical Analysis of HHGC 2024-05-10
Overview:
In analyzing the technical indicators for HHGC over the last 5 days, we will delve into the trend, momentum, volatility, and volume indicators to provide a comprehensive outlook on the possible stock price movement in the coming days. By examining these key aspects, we aim to offer valuable insights and recommendations for potential investors.
Trend Analysis:
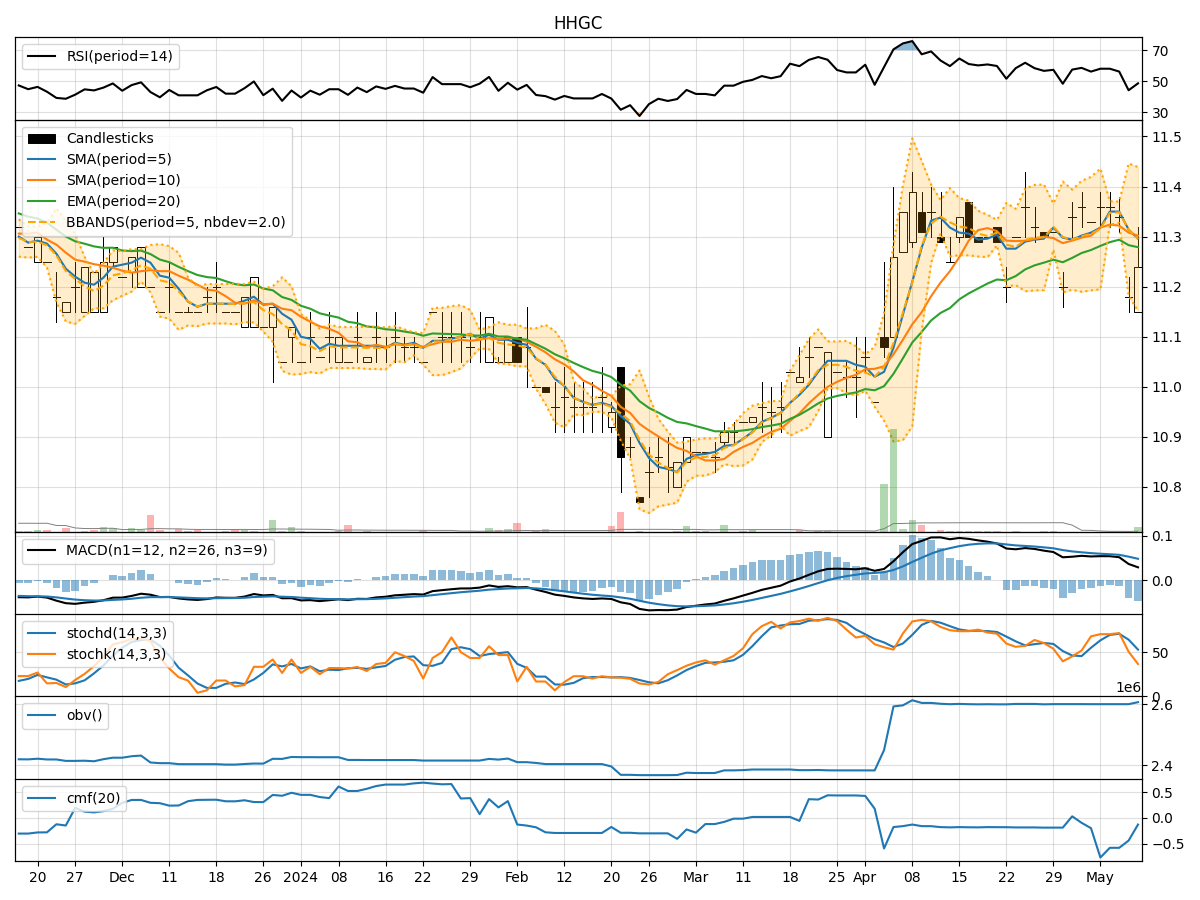
- Moving Averages (MA): The 5-day MA has been relatively stable around the closing prices, indicating a short-term trend. Both the SMA(10) and EMA(20) have shown slight fluctuations but have not diverged significantly.
- MACD: The MACD line has been positive over the past 5 days, suggesting a bullish momentum. However, the MACD Histogram has been decreasing, indicating a potential slowdown in the bullish momentum.
Momentum Analysis:
- RSI: The RSI has fluctuated within a moderate range, indicating neither overbought nor oversold conditions.
- Stochastic Oscillator: Both %K and %D have been declining, suggesting a weakening momentum. The current levels are not in oversold territory but are approaching lower levels.
- Williams %R: The Williams %R has been consistently in oversold territory, indicating a bearish sentiment.
Volatility Analysis:
- Bollinger Bands (BB): The stock price has mostly stayed within the Bollinger Bands, with occasional breaches. The bands have not shown significant expansion or contraction, indicating stable volatility.
- Bollinger %B: The %B indicator has fluctuated within a moderate range, suggesting no extreme price conditions.
Volume Analysis:
- On-Balance Volume (OBV): The OBV has shown a slight increase over the last 5 days, indicating some buying pressure. However, the overall trend is not significant.
- Chaikin Money Flow (CMF): The CMF has been negative, indicating a lack of buying pressure and potential distribution.
Conclusion:
Based on the analysis of the technical indicators, the stock of HHGC is currently exhibiting mixed signals: - Trend: The trend is relatively neutral with a slight bullish bias. - Momentum: The momentum is weakening, indicating a potential shift towards bearish sentiment. - Volatility: Volatility remains stable with no significant changes. - Volume: The volume indicators suggest a lack of strong buying pressure.
Possible Stock Price Movement:
Given the current technical indicators and the observed trends, the stock price of HHGC is likely to experience sideways consolidation in the coming days. Investors should exercise caution and closely monitor key support and resistance levels for potential breakout opportunities.