Technical Analysis of HELE 2024-05-10
Overview:
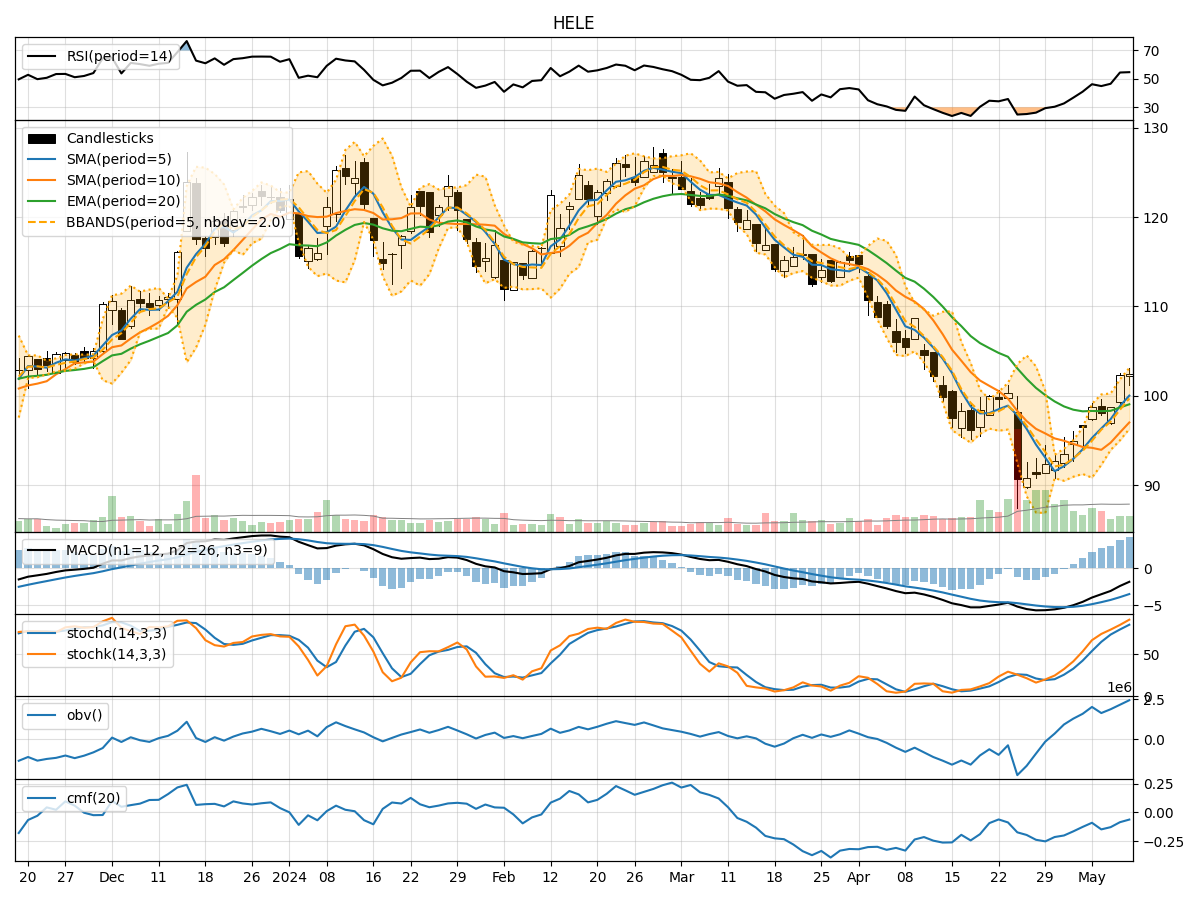
In analyzing the technical indicators for HELE over the last 5 days, we will delve into the trend, momentum, volatility, and volume indicators to provide insights into the possible future stock price movements. By examining these indicators, we aim to offer a comprehensive analysis and make informed predictions for the next few days.
Trend Indicators:
- Moving Averages (MA): The 5-day MA has been consistently above the closing prices, indicating an overall uptrend in the short term.
- MACD: The MACD line has been gradually decreasing but remains above the signal line, suggesting a potential slowdown in the uptrend.
- EMA: The EMA has been relatively stable and above the closing prices, indicating a bullish trend.
Momentum Indicators:
- RSI: The RSI has been fluctuating around the midline, indicating a lack of strong momentum in either direction.
- Stochastic Oscillator: Both %K and %D have been in the overbought territory, suggesting a potential reversal or consolidation.
- Williams %R: The indicator has been hovering around oversold levels, indicating a possible reversal to the upside.
Volatility Indicators:
- Bollinger Bands: The stock price has been trading within the bands, with the %B indicator showing fluctuations but no clear trend.
- Volatility: The volatility has been relatively stable, with no significant spikes or drops in the last 5 days.
Volume Indicators:
- On-Balance Volume (OBV): The OBV has shown a slight increase over the last 5 days, indicating some accumulation.
- Chaikin Money Flow (CMF): The CMF has been negative, suggesting some selling pressure in the stock.
Key Observations:
- The trend indicators suggest a bullish bias in the short term, supported by the moving averages and EMA.
- Momentum indicators show mixed signals, with RSI indicating neutrality, while stochastic and Williams %R hint at a possible reversal.
- Volatility has been relatively stable, indicating a lack of significant price fluctuations.
- Volume indicators show a slight increase in accumulation but overall negative money flow.
Conclusion:
Based on the analysis of the technical indicators, the next few days for HELE could see sideways consolidation with a slight upward bias. The trend indicators support a bullish view, while momentum indicators suggest a possible reversal or consolidation. Volatility remains stable, indicating limited price movements, and volume indicators show a slight increase in accumulation. Traders may consider cautious optimism in their approach, monitoring key support and resistance levels for potential breakout or breakdown scenarios.