Technical Analysis of HCM 2024-05-10
Overview:
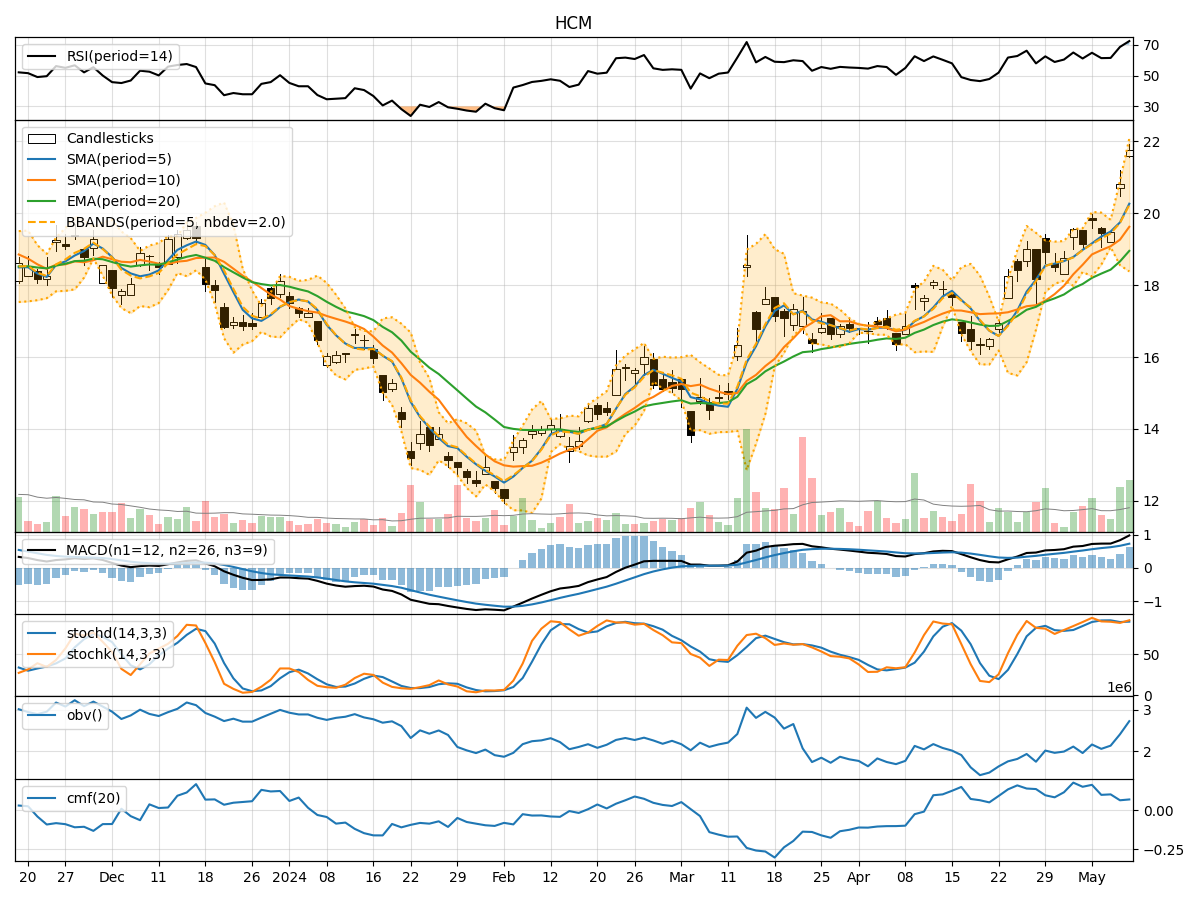
In analyzing the technical indicators for HCM stock over the last 5 days, we will delve into the trend, momentum, volatility, and volume indicators to provide a comprehensive outlook on the possible stock price movement in the coming days. By examining these key indicators, we aim to offer valuable insights and predictions for informed decision-making.
Trend Analysis:
- Moving Averages (MA): The 5-day Moving Average (MA) has been consistently rising, indicating a bullish trend in the short term.
- MACD: The MACD line has been increasing, crossing above the signal line, suggesting a bullish momentum.
- Relative Strength Index (RSI): The RSI has been trending upwards, indicating increasing buying pressure.
Momentum Analysis:
- Stochastic Oscillator: Both %K and %D lines of the Stochastic Oscillator have been in the overbought zone, suggesting a potential reversal or consolidation.
- Williams %R (WillR): The Williams %R has been fluctuating in the oversold and overbought zones, indicating mixed momentum.
Volatility Analysis:
- Bollinger Bands (BB): The stock price has been trading above the upper Bollinger Band, indicating overbought conditions and a potential reversal.
- Bollinger Band Width (BBW): The Bollinger Band Width has been expanding, suggesting increased volatility.
Volume Analysis:
- On-Balance Volume (OBV): The OBV has shown mixed signals, with fluctuations in volume accumulation.
- Chaikin Money Flow (CMF): The CMF has been positive but relatively flat, indicating stable money flow.
Conclusion:
Based on the technical indicators analyzed: - Trend: The stock is in an upward trend supported by moving averages and MACD. - Momentum: The momentum is mixed, with the Stochastic Oscillator signaling potential overbought conditions. - Volatility: The stock is experiencing increased volatility, as indicated by the expanding Bollinger Bands. - Volume: The volume indicators suggest mixed signals with no clear trend in accumulation.
Forecast:
Considering the overall analysis, the stock is likely to experience consolidation or a minor pullback in the coming days after the recent bullish run. Traders should exercise caution and consider potential profit-taking opportunities. It is advisable to wait for clearer signals from momentum indicators before making significant trading decisions.